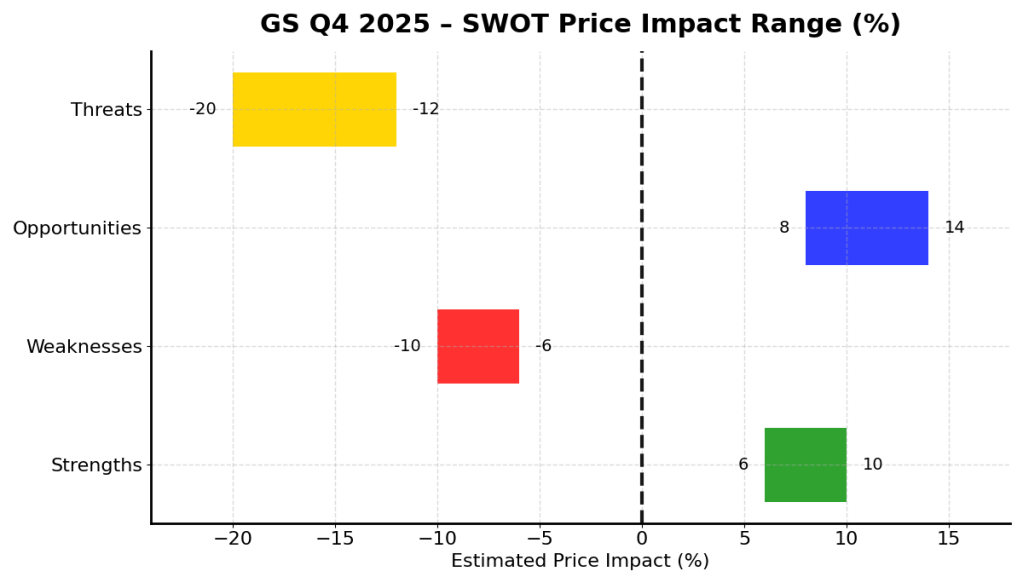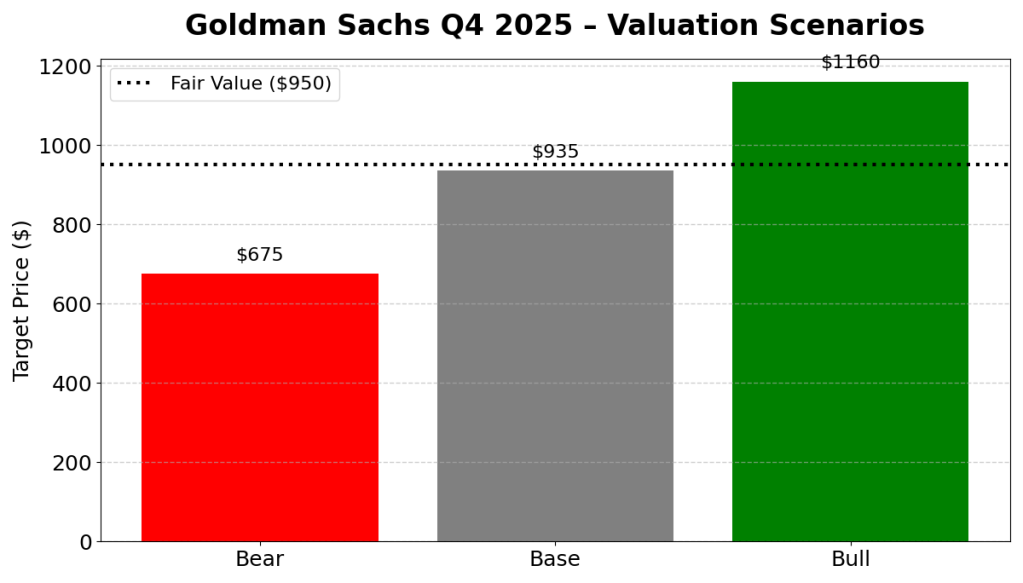
Accenture Q1 FY2026 Earnings: A Wonderful Business, Still Waiting for Growth

Accenture reported strong fiscal Q1 2026 results, exceeding revenue and earnings expectations while managing margins and generating cash. However, growth remains cautious with low-single-digit revenue increases. AI demand is emphasized as crucial for long-term growth, yet short-term challenges persist. The stock is viewed as fairly valued at approximately $270.

TL;DR

Accenture  (ACN:NYSE) delivered another quarter of solid execution, beating expectations on revenue and earnings while maintaining margins and strong cash generation. AI demand continues to build, but management remains cautious on near-term revenue acceleration. At around $270, ACN appears fairly valued, with upside dependent on whether AI-led reinvention can meaningfully lift topline growth.


Quarter Recap

  • Fiscal Q1 2026 revenue came in at the high end of guidance, reflecting resilient enterprise demand despite a cautious macro environment.
  • Adjusted earnings grew faster than revenue, supported by disciplined cost control and modest operating leverage.
  • New bookings remained healthy, including continued momentum in AI-related transformation programs.
  • Management reiterated a cautious full-year outlook, emphasizing execution and long-term positioning rather than near-term acceleration.

Key Highlights

  • Revenue growth remained in the low- to mid-single-digit range, consistent with guidance.
  • Adjusted operating margins expanded modestly year over year.
  • Free cash flow supported ongoing dividends and share repurchases.
  • AI was framed as a core component of multi-year reinvention programs, not a standalone growth spike.
  • U.S. federal-related work continued to weigh on near-term growth visibility.

SWOT Analysis

Accenture’s investment profile reflects a balance between durable execution strength and a growth trajectory that remains steady rather than accelerating. The ranges below translate qualitative factors into estimated stock price impact.

Strengths

  • Deep enterprise relationships and recurring transformation demand (+8% to +12%)
  • AI embedded into large-scale reinvention programs, supporting long-term monetization (+6% to +10%)
  • Strong cash flow, balance sheet discipline, and shareholder returns (+4% to +6%)

Strengths — overall impact: +18% to +28%


Weaknesses

  • Low-single-digit organic revenue growth profile (–6% to –10%)
  • Continued softness in U.S. federal business (–4% to –7%)
  • Premium valuation leaves limited margin for disappointment (–5% to –8%)

Weaknesses — overall impact: –15% to –25%


Opportunities

  • Scaling AI-led reinvention programs across global enterprises (+10% to +18%)
  • Operating leverage if demand gradually normalizes (+6% to +10%)
  • Leadership role as an enterprise AI orchestrator across platforms and models (+5% to +8%)

Opportunities — overall impact: +21% to +36%


Threats

  • Prolonged enterprise budget caution delaying large transformation decisions (–10% to –15%)
  • Investor narrative around AI commoditization compressing consulting multiples (–8% to –12%)
  • Competitive pricing pressure from smaller firms and in-house teams (–5% to –8%)

Threats — overall impact: –23% to –35%

Accenture Q1 FY2026 SWOT price impact chart showing estimated stock impact ranges: strengths +18% to +28%, weaknesses −15% to −25%, opportunities +21% to +36%, and threats −23% to −35%, with a dashed zero reference line.

Valuation Scenarios

Accenture’s valuation outcome hinges less on margin execution—which remains strong—and more on whether AI-driven reinvention can re-accelerate revenue growth.

Using $270 as the current price anchor:

Bear Case

  • Revenue growth remains around 2–3%
  • Federal weakness persists and AI monetization is slower than expected
  • Valuation multiple compresses toward the lower end of historical ranges
  • Implied price: ~$209 (–22.5%)

Base Case

  • Revenue growth stabilizes around 4–5%
  • AI bookings convert gradually into revenue
  • Margins expand modestly, supporting high-single-digit EPS growth
  • Implied price: ~$290 (+7.5%)

Bull Case

  • AI-led reinvention drives sustained revenue acceleration above 6%
  • Enterprise spending cycle improves
  • Operating leverage supports double-digit EPS growth with modest multiple expansion
  • Implied price: ~$351 (+30%)

Fair Value Assessment

Applying a probability-weighted approach:

  • Bear: 25%
  • Base: 50%
  • Bull: 25%

This results in a probability-weighted fair value of approximately $285, or about 5–6% upside from current levels.

Accenture valuation scenarios chart based on Q1 FY2026 earnings, showing bear case price target of $209, base case $290, bull case $351, and a probability-weighted fair value of $285.

Verdict

Accenture remains a high-quality compounder with durable client relationships, strong execution, and disciplined capital returns. At around $270, the stock looks fairly valued rather than cheap. Downside is cushioned by cash flow and margins, but meaningful upside will require clearer evidence that AI-led reinvention can translate into sustained topline acceleration.


Call to Action

If you’re tracking enterprise AI adoption beyond the hype, follow SWOTstock for earnings-driven analysis that focuses on what actually moves stock prices.


Disclaimer

This article is for informational purposes only and does not constitute investment advice. All analysis is based on publicly available, official company disclosures and earnings call commentary. Investors should conduct their own research or consult a financial professional before making investment decisions.


Oracle Q2 FY2026 — Revenue Miss, AI Backlog Surge, and a 14% Drop: Value Reset or Warning Sign?

Oracle’s Q2 FY2026 results showed mixed performance with revenue at $16.06B slightly below expectations, while adjusted EPS at $2.26 was aided by a one-time gain. A significant $523B RPO backlog indicates strong future demand, yet stock fell over 10% to ~$199 amid concerns over profitability and capital intensity.

TL;DR Summary

Oracle (NYSE: ORCL) reported mixed Q2 FY2026 results: revenue came in slightly below expectations, adjusted EPS beat but was boosted by a one-time gain, and OCI continued strong but not hyper-scale acceleration. The standout metric was a massive $523B RPO backlog, signaling powerful long-term demand for AI and cloud infrastructure. Yet the stock still dropped over 10% after hours to ~$199 as investors recalibrated near-term profitability, cloud CapEx intensity, and the quality of earnings. Our fair value stands at $210–$215, with the pullback offering a more reasonable entry point for value-oriented investors who can tolerate AI-cycle volatility.


Quarter Recap

Oracle released its Q2 FY2026 results on December 10. Total revenue reached $16.06B, a modest YoY increase but a slight miss versus expectations. Adjusted EPS beat estimates at $2.26; however, the strength was driven by a $2.7B pretax gain from selling Oracle’s stake in Ampere Computing. OCI remained a bright spot, growing roughly 68% YoY and supported by AI training and inference demand, although growth did not exceed bullish expectations.

The biggest surprise came from Remaining Performance Obligations (RPO), which surged to $523B — one of the highest forward-demand indicators in enterprise tech. Despite this, the stock sold off sharply as investors focused more on margin pressure, heavy CapEx needs, and the softer revenue print. By late after-hours trading, Oracle shares had fallen to around $199, down more than 10%.


Key Highlights

  • Revenue: $16.06B, slightly below consensus
  • Adjusted EPS: $2.26, aided by a one-time Ampere stake sale
  • OCI: ~68% YoY growth, strong but not accelerating beyond expectations
  • RPO: Jumped to $523B, signaling multi-year cloud and AI demand
  • CapEx & Debt: Rising commitments for cloud infrastructure expansion
  • Market Reaction: Stock dropped from ~$230 to ~$199 after hours

SWOT Analysis

Oracle’s Q2 results highlight a company balancing immense long-term opportunity with near-term financial strain. While the AI infrastructure cycle is driving unprecedented backlog levels, the path to monetizing this demand profitably remains uncertain. The sell-off reflects this tension: long-term durable demand on one side, and rising costs, slower revenue, and an inflated EPS figure on the other.

Strengths (Price Impact: +6% to +12%)

  • Massive RPO backlog of $523B supporting multi-year revenue visibility (+3% to +5%)
  • Highly sticky database and support revenue base anchoring cash flow (+2% to +4%)
  • Strong OCI growth of ~68% YoY securing relevance in AI infrastructure (+3% to +5%)
  • Consistent capital returns through buybacks and dividends (+1% to +2%)

Weaknesses (Price Impact: –6% to –12%)

  • Revenue miss relative to AI-fueled expectations (–3% to –5%)
  • EPS beat driven by one-time Ampere stake sale (–2% to –4%)
  • Near-term margin pressure from heavy cloud infrastructure investments (–3% to –5%)
  • Elevated debt profile reducing financial flexibility (–1% to –2%)

Opportunities (Price Impact: +10% to +18%)

  • Multi-year AI infrastructure demand cycle boosting OCI adoption (+5% to +8%)
  • Database migration to OCI offering structural margin lift (+3% to +5%)
  • Cerner modernization creating long-term operating leverage (+2% to +4%)
  • Enterprise consolidation driving large, integrated cloud modernization deals (+2% to +3%)

Threats (Price Impact: –12% to –20%)

  • CapEx requirements rising to fulfill massive AI/cloud backlog (–5% to –8%)
  • Fierce competition from AWS, Azure, and Google Cloud (–3% to –6%)
  • AI contract profitability still unclear and may dilute margins (–2% to –4%)
  • Macro slowdown could hit enterprise IT spending (–2% to –3%)
Oracle Q2 FY2026 SWOT analysis chart showing estimated stock price impact ranges: Strengths +6% to +12%, Weaknesses –12% to –6%, Opportunities +10% to +18%, and Threats –20% to –12%, displayed on a horizontal bar chart with x-axis starting at –25%.

Valuation Scenarios

With shares falling to ~$199, Oracle now trades below our intrinsic value range. The key valuation driver is how quickly OCI can scale profitably relative to the heavy CapEx needed to support long-term AI demand. Below are three scenarios based on earnings normalization, cloud margin trajectories, and the appropriate earnings multiple for a hybrid software + cloud infrastructure business.

Bear Case — $175

  • OCI slows to 40–50%
  • CapEx stays elevated for multiple years
  • Core EPS normalizes lower after removing one-time gains
  • Multiple compresses to 15× forward EPS
  • Price Target: ~$175

Base Case — $215

  • OCI grows 55–65%
  • Revenue normalizes to mid-single digits
  • CapEx moderates by FY2027
  • Margins expand gradually
  • Valuation at ~17.5× forward EPS
  • Price Target: ~$215

Bull Case — $255

  • OCI re-accelerates to 70%+
  • AI contracts become margin accretive
  • Cloud and software synergy improves profitability
  • Market assigns a premium 20× forward multiple
  • Price Target: ~$255

Fari Value

Assigning scenario probabilities:

  • Bear: 30%
  • Base: 50%
  • Bull: 20%

FV = (175 x 0.3) + (215 x 0.5) + (255 x 0.2)

= 52.5 + 107.5 + 51 = 211

🎯 Probability-Weighted Fair Value = $211

Oracle Q2 FY2026 valuation scenarios chart comparing Bear case price target $175, Base case $215, and Bull case $255, with a dashed line indicating the probability-weighted fair value of $211.

Verdict

Oracle’s Q2 numbers delivered a mixed message: enormous long-term demand but weaker near-term fundamentals. The stock’s drop to ~$199 reflects investors resetting expectations for cloud profitability and earnings quality. Still, the pullback now places Oracle below our fair value estimate, creating a potentially attractive entry point for long-term, value-oriented investors who accept AI-cycle volatility. For investors seeking steady cash flow, disciplined capital returns, and long-term cloud upside, Oracle now screens more reasonable than before.


Call to Action

If you want structured, fact-based breakdowns of every earnings season — from Big Tech to industrials to retail — subscribe to SWOTstock. We turn dense earnings reports into clear insights so you can invest with conviction, not noise.


Disclaimer

This analysis is for informational purposes only and is not financial advice. All estimates are based on publicly available company filings and earnings calls. Investors should conduct their own due diligence before making investment decisions.


Bank of America Q3 2025 — “Steady Hands in a Choppy Cycle”

Bank of America demonstrated strong Q3 2025 results with an EPS of $1.06 and a net interest income of $15.2 billion, alongside a 43% rise in investment-banking fees. Management’s increased Q4 guidance reflects confidence. The bank’s stability positions it as a reliable choice for value investors amid economic uncertainty.

TL;DR

Bank of America reported a steady and resilient Q3 2025: EPS came in at $1.06, net interest income rose to $15.2 billion, and investment-banking fees jumped 43%. Management also raised Q4 NII guidance, signaling confidence heading into year-end. After the release, the stock traded roughly 2–3% higher, reflecting a market that values stability in a choppy macro environment. For DIY value investors, this quarter underscores BofA’s role as a dividend-reliable, moderately undervalued financial anchor rather than a high-beta trade.


Quarter Recap

Bank of America delivered a steady and confident performance in Q3 2025, leaning more on disciplined execution than dramatic surprises. Net income reached $8.5 billion, translating to $1.06 per share, comfortably above expectations and supported by $15.2 billion in net interest income that remained resilient despite shifting rate dynamics. Management emphasized that positive operating leverage reflected tighter cost control and continued investment in risk management and technology. Capital markets activity added a welcome boost, with investment-banking fees rising 43% as dealmaking and underwriting improved from last year’s lows. Importantly for long-term investors, the bank’s CET1 ratio stayed above 12%, reinforcing its capacity to maintain dividends and pursue selective buybacks even in a more uncertain macro backdrop. Overall, the quarter underscored BofA’s ability to produce stable, repeatable earnings at a time when many peers are navigating more uneven conditions.


Key Highlights

  • EPS: $1.06, above internal targets and analyst expectations.
  • Net Interest Income: $15.2B, maintaining upward momentum.
  • Investment-Banking Fees: +43% YoY, continued rebound in capital markets.
  • Operating Leverage: Positive, reflecting disciplined expense control.
  • Credit Costs: Stable, no significant deterioration in consumer or commercial books.
  • Capital Position: CET1 above 12%, supporting sustained shareholder returns.
  • Guidance: Q4 NII raised to $15.6–15.7B, signaling management confidence.

SWOT Analysis

Strengths (+3% → +7%)

• Strong NII performance and EPS beat

• Well-managed expenses and positive operating leverage

• Dividend raised earlier this year, supported by capital strength

Weaknesses (–5% → –2%)

• Slower loan growth compared to peers

• Slight margin compression in wealth management

• Tech and compliance investments increasing non-interest expense

Opportunities (+4% → +10%)

• Investment-banking recovery (+43% YoY)

• Stable credit trends with room for normalization upside

• Rate-cycle normalization in 2026 may boost loan demand

Threats (–10% → –5%)

• CRE and credit-card segments remain watch-list risks

• Potential capital-rule tightening limiting buybacks

• Prolonged macro uncertainty affecting NII trajectory

Horizontal bar chart showing Bank of America Q3 2025 SWOT price impact ranges. Strengths (+3 to +7 %), Weaknesses (–5 to –2 %), Opportunities (+4 to +10 %), and Threats (–10 to –5 %). The chart uses green for strengths, red for weaknesses, blue for opportunities, and yellow for threats, with a dashed vertical line at zero indicating neutral impact.

Valuation Scenarios (12-Month Outlook)

Using official Q3 performance, NII guidance, and credit commentary:

Bull Case – $56 (+15%)

• Sustained NII strength

• Continued recovery in investment banking

• Flat credit losses into 2026

Base Case – $51.3 (+5%)

• Stable NII

• Moderate fee growth

• Expense discipline maintained

Bear Case – $44 (–10%)

• Margin compression from declining rates

• Credit costs rise toward the historical mean

• CRE pockets worsen

Probability-Weighted Fair Value:

(0.3 x 56) + (0.5 x 51.3) + (0.2 x 44) = approx. $51.1

Vertical bar chart illustrating Bank of America Q3 2025 valuation scenarios. Bear case $44 (20 %), Base case $51.3 (50 %), and Bull case $56 (30 %). A dashed horizontal line marks the calculated fair value at about $51 per share. Bars are color-coded red, gray, and green respectively.

Verdict

Bank of America continues to deliver what value-focused investors want: predictable earnings, conservative capital management, and a stable dividend.

This quarter didn’t redefine the company—but it didn’t need to.

Instead, it reinforced that BofA’s risk-reward profile is built on durability rather than excitement.

At around $50–51 post-earnings, shares sit close to their $51 fair value, leaving modest upside but strong downside support. For long-term investors comfortable with financial-cycle volatility, BofA remains a hold with opportunistic accumulation on dips below $48.


Call to Action

If you find this style of earnings-driven, valuation-based analysis helpful, follow SWOTstock for more breakdowns across banks, tech, and industrials—always grounded in official filings and management commentary.


Disclaimer

This article is for informational and educational purposes only. It does not constitute investment advice or a recommendation to buy or sell any securities. All analysis is based solely on Bank of America’s official Q3 2025 financial results and publicly available management commentary. Investors should conduct their own research or consult a licensed advisor before making investment decisions.