Goldman Sachs Q4 2025: Earnings Power Is Back — Valuation Now Demands Durability

Goldman Sachs reported a strong Q4 2025, highlighting a recovery in capital markets with net revenues of $13.45 billion and net income of approximately $4.6 billion. The stock is now valued on sustained earnings strength, with future returns dependent on the durability of this recovery. Key opportunities and threats are outlined in a SWOT analysis.

TL;DR

Goldman Sachs (GS:NYSE) delivered a strong Q4 2025, confirming that capital markets activity has meaningfully recovered and earnings power has re-emerged. At today’s price, GS is no longer a balance-sheet or re-rating story. The stock is valued on sustained earnings strength, with future returns increasingly dependent on how durable this recovery proves to be through the next cycle.
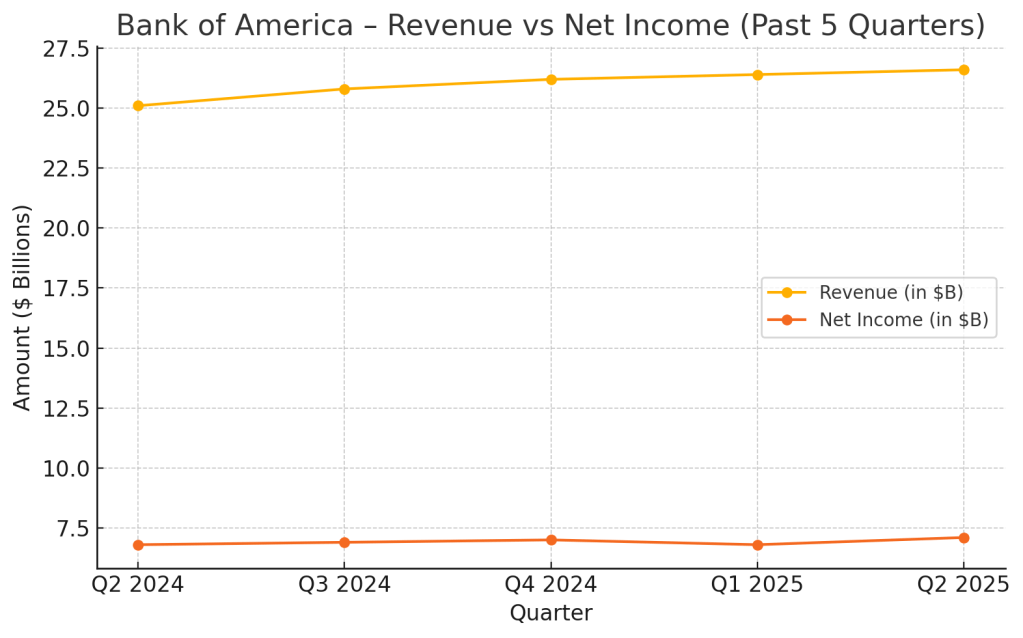

Quarter Recap

Goldman Sachs closed out 2025 with a solid fourth quarter, reflecting improved client engagement across Investment Banking and Global Markets. Revenues rebounded, profitability strengthened, and returns moved back into the mid-teens. Management commentary pointed to healthier capital markets conditions and disciplined capital deployment, reinforcing the sense that GS has exited its post-cycle trough.


Key Highlights

  • Q4 net revenues: $13.45bn, driven by stronger Investment Banking and Markets activity
  • Net income: ~$4.6bn
  • EPS: $14.01, up meaningfully year over year
  • Annualized ROE: ~16%, back above through-cycle targets
  • Book value per share: $357.60
  • Quarterly dividend increased to: $4.50, signaling confidence in earnings durability
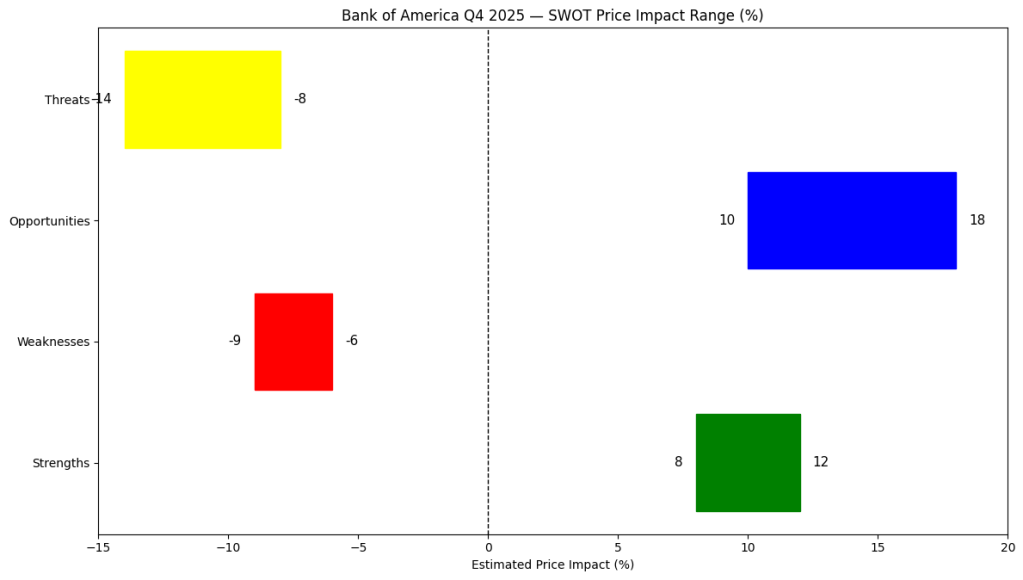
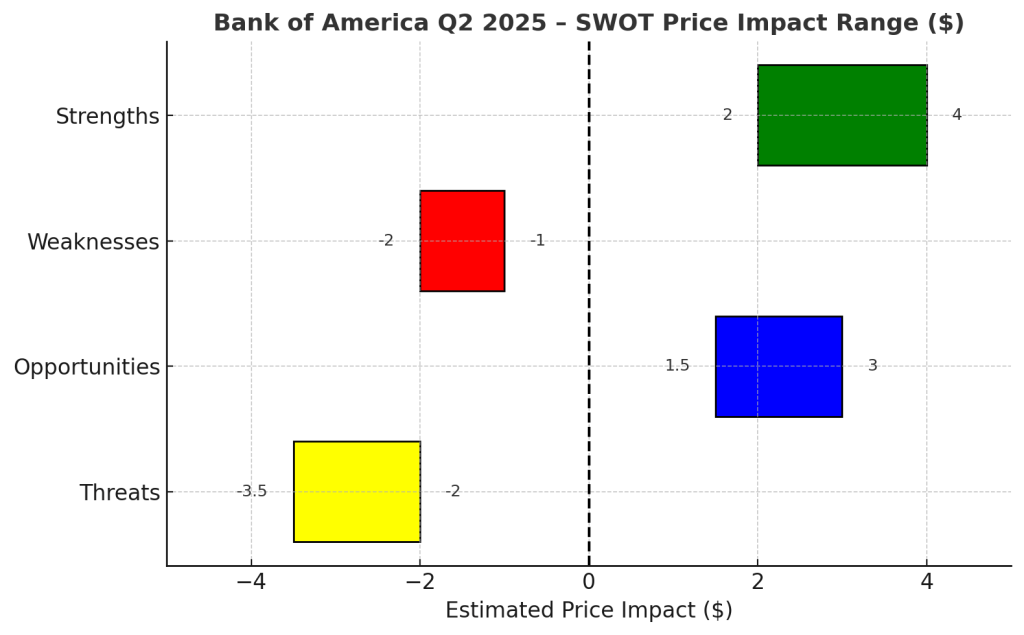
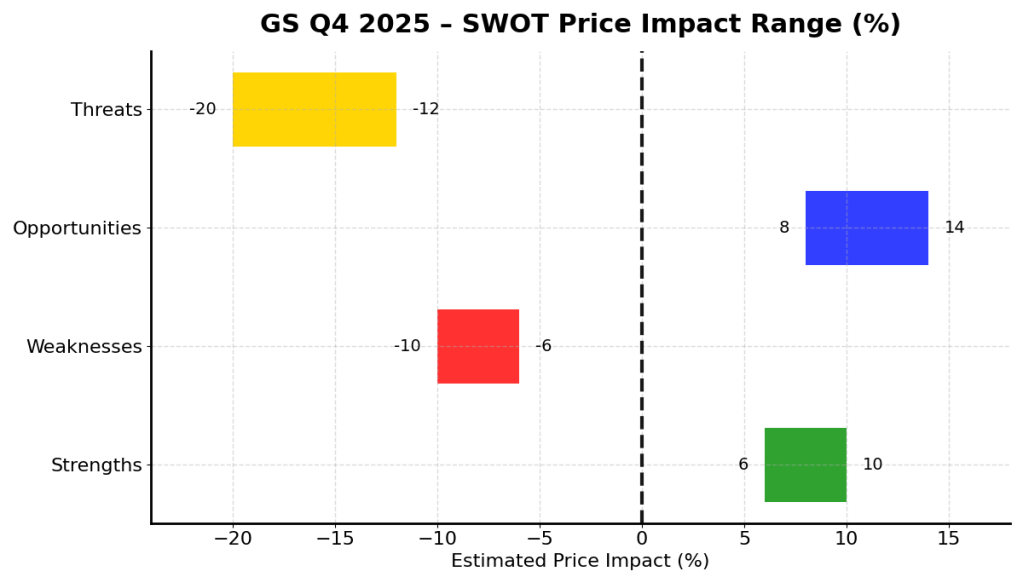
SWOT Analysis

At current valuation levels, Goldman Sachs is being priced primarily on normalized earnings power, not balance-sheet metrics. The SWOT below reflects that shift.

Strengths

Goldman’s core franchise is reasserting itself as capital markets normalize, with operating leverage returning across its most profitable businesses.

  • Investment Banking and trading rebound driving earnings momentum (+6% to +10%)
  • Mid-teens ROE supports a premium earnings multiple (+4% to +7%)

Weaknesses

Despite improvement, earnings remain inherently cyclical and sensitive to market conditions.

  • Revenue volatility tied to deal flow and trading activity (-6% to -10%)
  • Asset & Wealth Management margins remain below peak potential (-3% to -5%)

Opportunities

If capital markets recovery proves durable, earnings power could exceed current expectations.

  • Sustained M&A and issuance activity into 2026 (+8% to +14%)
  • Continued dividend growth and buybacks supporting total returns (+3% to +6%)

Threats

At current valuation levels, downside risk increases if the cycle turns earlier than expected.

  • Macro or market shock reducing client activity (-12% to -20%)
  • Regulatory or capital rule changes constraining ROE and payout capacity (-4% to -7%)
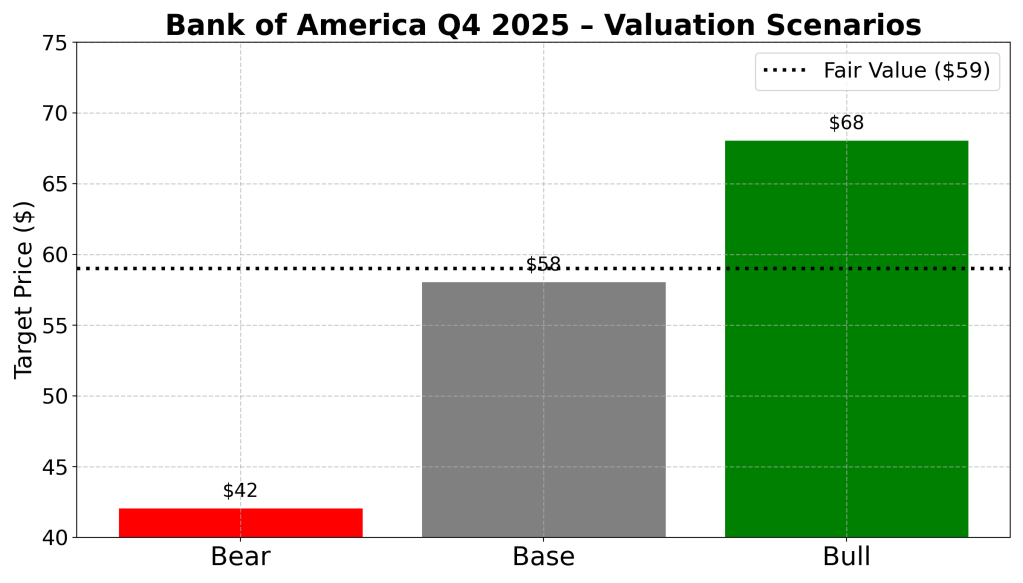
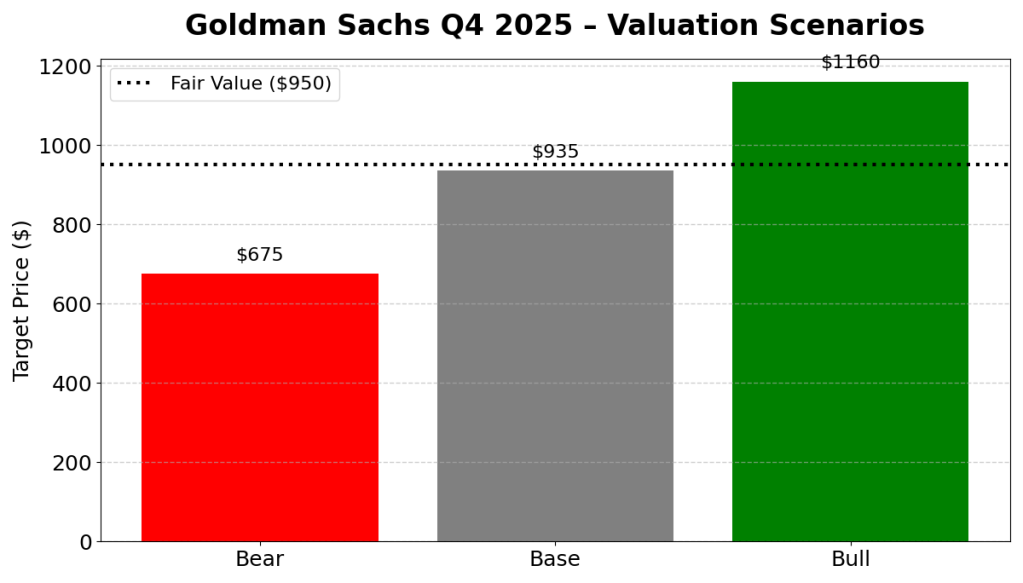
SWOT price impact range chart for Goldman Sachs Q4 2025, showing estimated percentage impact of strengths, weaknesses, opportunities, and threats on the share price.
SWOT price impact ranges highlight that Goldman Sachs’ upside is driven by capital markets recovery and earnings leverage, while downside risk remains tied to cycle sensitivity and macro conditions.

Valuation Scenarios

With GS trading far above book value, valuation should be framed around normalized earnings, not balance-sheet multiples.

Bear Case (~$675)

This scenario assumes the current capital markets rebound fades as macro conditions tighten.

  • Normalized EPS declines toward ~$45
  • Investment Banking and trading activity cool meaningfully
  • Operating leverage works in reverse, pressuring margins
  • Valuation compresses to ~15× earnings, typical of late-cycle conditions

Base Case (~$935)

The base case assumes capital markets stabilize at healthier, mid-cycle levels.

  • Normalized EPS of ~$52, broadly in line with FY 2025 earnings power
  • Deal activity and trading remain solid but not overheated
  • The stock trades at ~18× earnings, reflecting franchise strength with cyclical risk

Bull Case (~$1,160)

The bull case assumes a sustained and broad-based capital markets recovery.

  • Normalized EPS rises toward ~$58
  • Strong M&A, IPO, and trading activity drive operating leverage
  • Valuation expands to ~20× earnings on improved earnings visibility

Probability-Weighted View

  • Bear: 25%
  • Base: 50%
  • Bull: 25%

Probability-weighted fair value: ~$950

Valuation scenarios bar chart for Goldman Sachs Q4 2025 showing bear, base, and bull target prices with a dotted fair value line.
Valuation scenarios show Goldman Sachs trading near base-case assumptions, with upside tied to sustained earnings power and downside risk if capital markets momentum fades.

Verdict

Goldman Sachs has transitioned from a recovery story to an earnings-power story. At current levels, the stock appears fairly valued on normalized earnings, with upside now dependent on sustaining capital markets momentum rather than further multiple expansion. GS remains a high-quality franchise, but future returns will increasingly reflect execution and cycle durability.


Call to Action

If you’re tracking U.S. banks and capital markets exposure, follow SWOTstock for earnings-driven analysis that focuses on valuation realism — not headline noise.


Disclaimer

This content is for informational purposes only and does not constitute investment advice. Investors should conduct their own research.


Bank of America Q4 2025 Earnings — Waiting for the Rate Cycle, Not the Franchise

Bank of America reported strong Q4 results, with earnings and revenue exceeding expectations despite pressures on net interest income. The bank’s capital ratios remain healthy, and credit costs are controlled. However, future performance hinges on interest rate normalization and capital return timing. Current stock valuation suggests a hold or accumulate strategy for investors.

TL;DR Summary

Bank of America (BAC: NYSE) delivered a solid Q4, reinforcing the durability of its core franchise even as net interest income continued to soften. Earnings exceeded expectations, credit remained well-behaved, and capital levels stayed comfortably above regulatory requirements. At around $53 per share, the stock appears fairly valued to modestly undervalued, but the upside case remains dependent on rate normalization and capital return timing, not quarterly momentum. BAC is no longer under stress — but it is still in a waiting phase.


Quarter Recap

Bank of America reported Q4 2025 results that confirmed earnings resilience amid an unfavorable interest-rate backdrop. Revenue and EPS came in ahead of expectations, supported by strong trading performance and diversified fee income, which partially offset continued pressure on net interest income.

While credit costs remained within management’s guidance, the quarter also made clear that NII has not yet bottomed, delaying the point at which operating leverage can meaningfully re-emerge. Management reiterated confidence in the underlying strength of the U.S. consumer and emphasized balance-sheet flexibility, while acknowledging that the pace and shape of rate cuts will be the dominant driver of earnings normalization into 2026.


Key Highlights

  • Revenue of approximately $28.4B and EPS of $0.98 exceeded consensus expectations
  • Net interest income continued to decline, with no clear trough yet visible
  • Trading and markets revenues provided meaningful offset to rate-driven pressure
  • Credit costs remained controlled and within guided ranges
  • Capital ratios stayed comfortably above regulatory minimums, preserving long-term buyback optionality

SWOT Analysis

Bank of America’s Q4 results reinforce a familiar conclusion: this is a high-quality, systemically important bank whose valuation is now driven less by execution risk and more by macro timing and capital deployment.

Strengths

Bank of America’s scale, deposit franchise, and balance-sheet strength continue to provide earnings durability across cycles. Despite ongoing NII pressure, the bank generated mid-teens returns on tangible equity, underscoring the resilience of its core business. Diversified revenue streams — particularly in markets and fee-based businesses — further reduce earnings volatility and reinforce franchise quality.

Estimated price impact: +$5 to +$8

Weaknesses

Net interest income remains under pressure as asset yields reset faster than deposit costs can adjust. In addition, the bank’s structurally high cost base limits operating leverage in a slow-growth environment, delaying the inflection point investors are waiting for.

Estimated price impact: −$4 to −$7

Opportunities

A gradual rate normalization cycle would allow NII to stabilize and support a re-rating toward historical mid-cycle valuation multiples. In parallel, the eventual re-acceleration of share buybacks could materially enhance EPS growth even in a modest revenue environment, providing a powerful lever for shareholder value creation.

Estimated price impact: +$6 to +$10

Threats

The primary downside risk remains macro-driven. Faster-than-expected rate cuts would extend margin pressure, while any material deterioration in consumer or commercial credit would quickly overwhelm incremental operating improvements. Regulatory intervention also remains a persistent, though less immediate, structural risk.

Estimated price impact: −$6 to −$12

Horizontal SWOT price-impact chart for Bank of America Q4 2025 showing estimated percentage ranges: strengths and opportunities on the positive side, weaknesses and threats on the negative side, with a dashed zero reference line.
Bank of America Q4 2025 — Estimated SWOT price-impact ranges based on earnings results and macro assumptions. Early-stage view, not a final valuation

Valuation Scenarios

Bank of America should be valued using a normalized return-on-tangible-equity framework, rather than quarter-to-quarter earnings volatility. The scenarios below reflect how changes in rates, credit, and capital returns would shape valuation outcomes.

Bear Scenario

This scenario assumes prolonged NII pressure combined with rising credit costs, forcing valuation toward the lower end of historical P/TBV ranges.

  • Assumptions: NII continues to decline into 2026; credit losses rise above guidance; buybacks remain constrained
  • Implied value: ~$40–43

Base Scenario

This reflects the current market view: NII bottoms over the next several quarters, credit normalizes, and modest capital returns resume.

  • Assumptions: Mid-teens ROTCE; stable credit; gradual buyback recovery
  • Implied value: ~$55–60

Bull Scenario

This scenario assumes a supportive rate environment, stable credit, and an accelerated buyback cycle that lifts EPS growth.

  • Assumptions: NII stabilization; strong capital return; valuation re-rates toward mid-cycle multiples
  • Implied value: ~$65–70

Probability-Weighted Fair Value

Taking these scenarios together, Bank of America’s fair value clusters around:

~$57–60 per share

Valuation scenarios bar chart for Bank of America Q4 2025 showing bear, base, and bull target prices, with a dotted horizontal line indicating the probability-weighted fair value estimate.
Bank of America Q4 2025 — Bear, base, and bull valuation scenarios with probability-weighted fair value based on normalized earnings and capital return assumptions

Verdict

Bank of America has moved decisively out of the “stress discount” phase, but it has not yet entered a clear re-rating regime. Q4 confirmed franchise strength and earnings durability, yet the stock remains anchored by uncertainty around rates and the timing of capital return acceleration.

At current levels, BAC is best viewed as a hold or accumulate-on-weakness position for DIY value investors. The upside case exists, but it is macro-dependent, not execution-driven. Patience — rather than optimism — remains the dominant investment requirement.


Call to Action

If you own Bank of America, the key question is no longer balance-sheet safety — that has been reaffirmed. The real question is whether the rate cycle will cooperate in unlocking earnings normalization and capital returns. For investors building resilient, valuation-aware portfolios, BAC remains a credible component — but not yet a high-conviction opportunity.


Disclaimer

This analysis is for informational purposes only and does not constitute investment advice. Always conduct your own research and consider your financial situation before making investment decisions.


Bank of America Q2 2025: Earnings Beat, Dividend Growth Ahead, and a Fair Value Play for Income Investors

TL;DR

Bank of America posted Q2 2025 EPS of $0.89, topping expectations, driven by record net interest income and robust trading revenue. Management reaffirmed NII guidance toward $15.5–$15.7 billion and announced an 8% dividend hike (raising forward yield to ~3.2%). While credit risks in commercial real estate and macro uncertainties persist, BAC remains fairly valued near $48, making it a steady, income‑oriented choice for DIY value investors.


Quarter Recap

In Q2 2025, Bank of America reported revenue of $26.6 billion (+4% YoY) with net interest income (NII) reaching $14.8 billion — a record high. Net income rose to $7.1 billion (EPS $0.89), beating estimates by 3 cents.

Management highlighted:

  • Efficiency progress: Non‑interest expenses dropped ~$600 million QoQ, with a target to reach ~60% efficiency ratio.
  • Deposit strength: 8th straight quarter of deposit growth, with average checking balances rising from $6K to $9.2K YoY.
  • Credit costs: Provisions increased to ~$1.6 billion, mainly from office‑related CRE loans.
  • Trading resilience: Markets revenue rose ~15% YoY, with management expecting a 13‑quarter growth streak to continue.
  • Shareholder returns: $7.3 billion in Q2 (dividends + buybacks) and an 8% dividend increase announced for Q3.

Key Highlights

  • EPS: $0.89 (+7% YoY), beat by 3 cents
  • Revenue: $26.6 billion (+4% YoY)
  • Net Interest Income: $14.8 billion (record)
  • Efficiency: Expenses down $600 million QoQ; targeting ~60% ratio
  • Dividend: 8% hike brings forward yield to ~3.2%
  • Asset quality: Net charge‑offs of $1.5 billion; provisions up to $1.6 billion
  • Deposits: 8th consecutive quarter of growth
Line chart showing Bank of America revenue and net income over the past five quarters, highlighting Q2 2025 growth in both metrics.

SWOT Analysis

  • Strengths (+$2 – 4 impact):
    Record NII, diversified revenue streams, improving efficiency, and a dividend hike reflecting capital confidence.
  • Weaknesses (−$1 – 2 impact):
    Slower revenue growth than peers, elevated CRE‑related losses, and a still‑high expense base.
  • Opportunities (+$1.5 – 3 impact):
    AI & digital investments, sustained deposit momentum, expanding trading revenue, and higher dividend yield enhancing total return.
  • Threats (−$2 – 3.5 impact):
    Tariff‑driven macro risks, potential Fed rate cuts compressing NII, and rising credit costs in commercial real estate.

Net price impact: ≈ +$1.0–1.5/share vs. pre‑earnings levels, supporting the current range.


SWOT Summary Table

Bank of America Q2 2025 SWOT price impact analysis table showing strengths, weaknesses, opportunities, and threats with estimated stock price impacts.
Bar chart showing Bank of America Q2 2025 SWOT price impact ranges: strengths (+2 to +4), weaknesses (−1 to −2), opportunities (+1.5 to +3), and threats (−2 to −3.5), with X-axis starting at −5.

Valuation Scenarios

To frame a realistic outlook for Bank of America’s stock, we modeled three scenarios based on management’s guidance, Q2 results, and macro risks. The Base Case assumes steady EPS growth, stable net interest income, and controlled expenses, keeping the stock near its current range. The Bull Case reflects a scenario where trading revenue momentum accelerates, the efficiency ratio improves faster toward the 60% target, and net interest income benefits from a slower‑than‑expected pace of Fed rate cuts. Conversely, the Bear Case factors in higher commercial real estate charge‑offs and a compressed margin environment from rapid rate cuts. These scenarios give a clear range of plausible outcomes for value investors, balancing potential upside with key risks.

Bank of America Q2 2025 valuation scenarios table showing bull case at $52, base case at $48, and bear case at $42 with probability-weighted fair value of $48.

Probability‑Weighted Fair Value:(0.5 × 48) + (0.3 × 52) + (0.2 × 42) ≈ $48

Bar chart showing Bank of America Q2 2025 valuation scenarios: Bear case at $42, Base case at $48, and Bull case at $52, with a dotted line for the $48 fair value.

Dividend Growth Snapshot

Bank of America’s 8% dividend hike for Q3 2025 raises the quarterly payout from $0.24 to $0.26 per share, pushing the forward yield to roughly 3.2% at current prices. This increase continues the bank’s consistent multi‑year trend of dividend growth, reflecting management’s confidence in earnings stability and capital strength. Combined with $7.3 billion in share buybacks during Q2, this makes BAC a compelling choice for income‑focused investors who prioritize reliable cash returns and long‑term capital appreciation.

  • Q2 dividend: $0.24/share → Q3: $0.26/share
  • 8% increase = forward yield of ~3.2% at $48/share

Peer Comparison

When compared to its large‑cap U.S. banking peers, Bank of America sits in the middle of the pack. At a price‑to‑book ratio of ~1.3× and forward P/E around 13×, it trades cheaper than JPMorgan (P/B ~1.6×, P/E ~12×) but at a premium to Citigroup (P/B ~0.8×, P/E ~9×). Dividend yield at ~3.2% (post‑hike) makes BAC more attractive than JPMorgan (~2.8%) but still below Citi’s ~4%. This positioning reflects its balanced profile: steadier than Citi, but with less growth momentum than JPMorgan — a mix that appeals to value‑oriented investors seeking income without extreme risk exposure.

Peer comparison table for Bank of America Q2 2025 versus JPMorgan and Citigroup, showing price-to-book, price-to-earnings, and dividend yield metrics.

Verdict

At ≈$48/share, BAC trades close to our fair value estimate. For DIY value investors, it offers steady dividendsaggressive buybacks, and a resilient balance sheet. While upside is modest without macro support, the dividend hikeand sustained trading & deposit growth make it a hold‑to‑accumulate for long‑term portfolios.


Call to Action

Do you hold Bank of America or other bank stocks? Comment below — is BAC your top pick for steady income, or do you prefer peers like Citi or JPMorgan?


Disclaimer

This analysis is for informational purposes only and based solely on Bank of America’s official Q2 2025 financial report and earnings call. It does not constitute financial advice. Please consult a licensed advisor before making investment decisions.