Walmart Q1 2025: E-Commerce Turns a Profit—But Is That Enough for the Stock to Break Out?

Walmart reported strong Q1 FY2026 results, with sales rising to $165.61 billion and e-commerce profitability achieved globally. Despite these positives, stock prices remained flat due to inflation, pricing pressures, and a lack of EPS guidance. While Walmart presents growth opportunities, macroeconomic risks traditionally temper investor enthusiasm.

Quick Take: Steady Growth, But Macro Risks Keep a Lid on the Rally

Walmart (NYSE: WMT) delivered a strong Q1 with rising sales, expanding operating income, and—most importantly—e-commerce profitability. Yet the stock barely moved. Why? Inflation, pricing pressure, and the decision to withhold EPS guidance signal near-term caution. For long-term, low-risk growth seekers, Walmart still looks like a solid bet, but now’s the time to watch execution closely.


Quarter Recap: A Landmark Quarter, But Tariff Warnings Weigh Heavily

Walmart’s Q1 FY2026 (calendar Q1 2025) showed revenue of $165.61 billion (+2.5% YoY), with operating income up 4.3%. U.S. comparable sales rose 4.5%, driven by strong performance in food and pharmacy. A standout highlight: e-commerce operations became profitable globally—a signal that Walmart’s long-term tech investments are beginning to pay off.

Despite this, the stock dipped –0.5% during regular trading and was down 4% at open, after an initial premarket rise. The reason? CEO Doug McMillon acknowledged that Walmart would raise prices in response to persistent tariffs. And critically, the company withheld EPS guidance, citing economic uncertainty.

Why this quarter matters: Walmart just hit a key profitability milestone in digital—but cost pressures and visibility concerns are limiting investor enthusiasm.


Walmart Q1 2025 – Key Financial Highlights

  • Revenue: $165.61B (+2.5% YoY)
  • Net Income: $4.49B (down from $5.10B YoY)
  • EPS: $0.61 (beat by $0.03)
  • U.S. Comp Sales: +4.5%
  • Global E-commerce Sales: +22% YoY
  • E-commerce Profitability: First time achieved globally
  • Operating Income: +4.3%
  • FY Guidance: Reaffirmed 3–4% sales growth; EPS guidance withheld
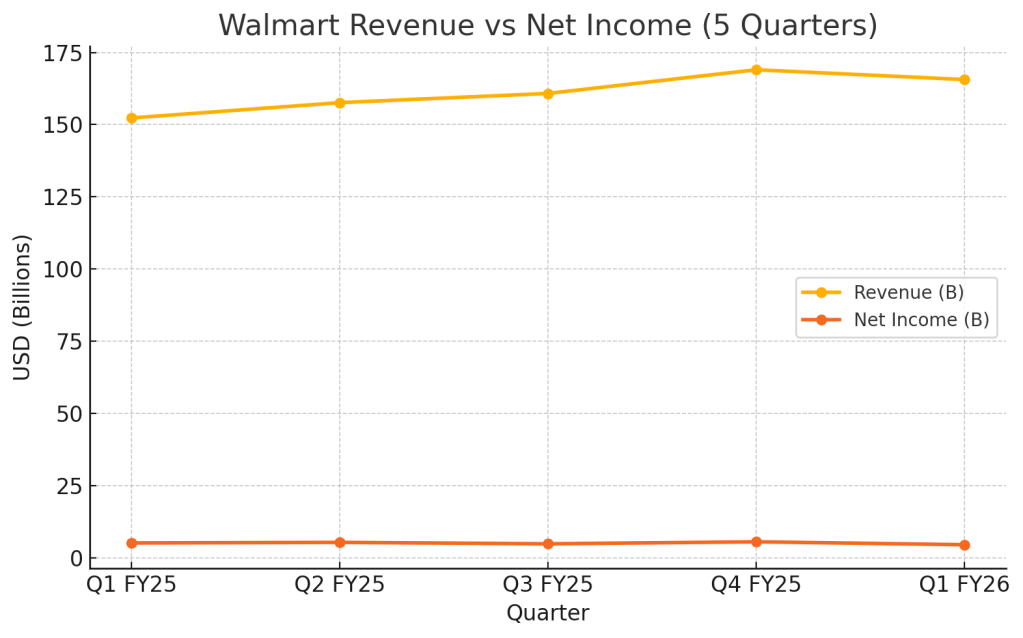
Line chart showing Walmart's revenue and net income trend over five quarters, highlighting solid sales with recent profit compression.

Walmart vs. Amazon vs. Target: Who’s Winning the Retail Transformation?

MetricWalmartAmazonTarget
E-commerce ProfitabilityAchieved (Q1 2025)Long-establishedStill lagging
In-store Sales Growth+4.5% U.S. compsMinimal (no store footprint)Flat to slightly negative
Ad Revenue MonetizationExpanding (Walmart Connect)Robust (Amazon Ads)Early stage
Inventory StrategyAI + automation scalingLogistics leaderStruggling with excess
Guidance ToneCautious, no EPS givenConfidentDefensive, cost-cutting

Takeaway: Walmart is the only large-format retailer with profitable e-commerce and store traffic momentum. It lags Amazon in tech monetization but is clearly outpacing Target in operational agility.


SWOT Breakdown: Walmart’s Digital Wins Meet Margin Headwinds

Let’s break it down using a simple SWOT framework—what’s going well, what’s not, where the upside lies, and what risks could derail the story.

Strengths

Walmart is scaling e-commerce profitably while growing in-store comps. Fulfillment efficiency and automation are boosting operating income.

Stock Price Impact Estimate:
Could support a +$3 to +$5 upside if this continues.

Weaknesses

Margins remain pressured. Net income declined, and the decision not to issue EPS guidance raises questions about confidence in short-term forecasting.

Stock Price Impact Estimate:
Could cap the stock by –$1 to –$3 per share.

Opportunities

Automation, Walmart+, advertising, and health services offer high-margin growth channels. AI integration in logistics and demand planning could unlock additional EPS upside.

Stock Price Impact Estimate:
If scaled well, could add +$4 to +$6 to valuation.

Threats

Tariffs, inflation, and pricing action could impact demand—especially in general merchandise. Management’s caution suggests macro risk isn’t fully priced in.

Stock Price Impact Estimate:
Worst-case downside of –$4 to –$6.
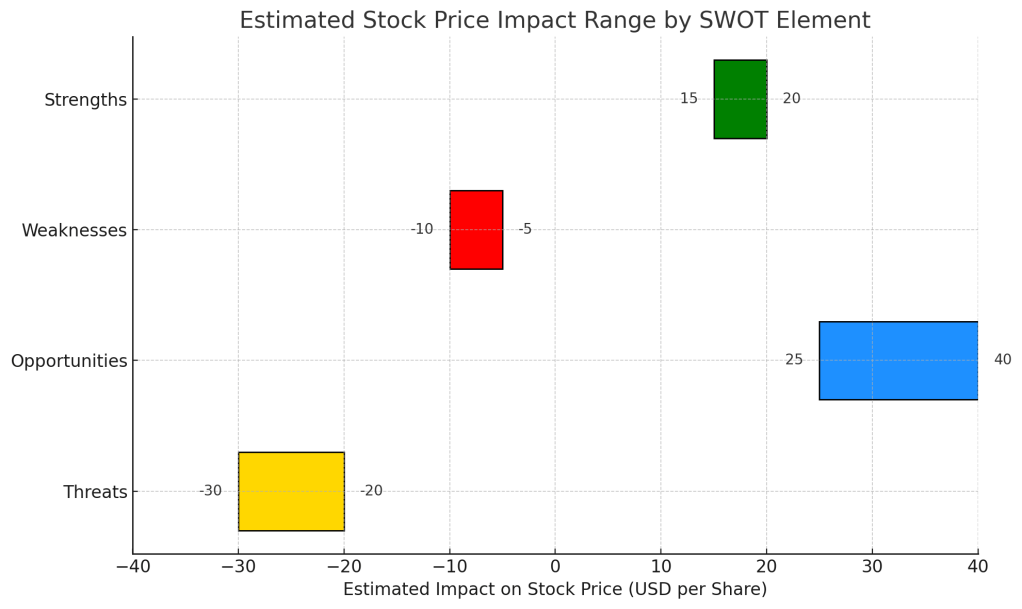
Horizontal bar chart estimating stock price impact ranges for Walmart’s Q1 2025 SWOT elements: strengths, weaknesses, opportunities, and threats.

SWOT Table Summary

CategoryKey TakeawaysEst. Stock Impact
StrengthsSolid comp growth, e-commerce profitability+$3 to +$5
WeaknessesMargin pressure, EPS visibility unclear–$1 to –$3
OpportunitiesMonetization of tech, AI, memberships, ad platform+$4 to +$6
ThreatsTariffs, inflation, pricing backlash–$4 to –$6
Four-quadrant SWOT chart summarizing Walmart’s Q1 2025 strengths, weaknesses, opportunities, and threats with the Walmart logo in the center.

Valuation Scenarios: How Walmart Stock Could Play Out from Here

Let’s revisit Walmart’s valuation in light of its solid operational execution, profitability in e-commerce, and the macro risks it faces. With the current stock price at $96.35, here’s how the stock could move in three realistic scenarios.


Base Case (Most Likely – 50%)

  • Summary: Walmart maintains low-single-digit revenue growth, keeps e-commerce profitable, and stabilizes margins with the help of automation and better inventory management. However, wage inflation and tariffs continue to pressure near-term earnings. EPS growth remains modest, and valuation multiples stay flat.
  • Fair Value Estimate: $100
  • Probability: 50%

Bull Case (Optimistic – 30%)

  • Summary: Walmart’s automation and AI-driven efficiencies begin to show stronger results, driving margin expansion. Advertising and subscription revenue accelerate, and general merchandise demand rebounds despite pricing headwinds. The company regains multiple expansion as investors price in stronger long-term profitability.
  • Fair Value Estimate: $110
  • Probability: 30%

Bear Case (Downside – 20%)

  • Summary: Consumer demand weakens as inflation and tariff-related pricing continue to rise. Walmart is forced to absorb more costs to maintain competitiveness, leading to margin compression. EPS flattens or declines. Valuation contracts slightly due to uncertainty around macro execution.
  • Fair Value Estimate: $85
  • Probability: 20%
Bar chart showing Walmart's valuation scenarios—bear, base, and bull—based on Q1 2025 performance and forward outlook.

Weighted Average Fair Value Calculation

(64×0.5)+(72×0.3)+(52×0.2)=$64.00


Valuation Verdict

With the current price at $96.35 (as of May 15, 2025), Walmart appears slightly undervalued based on its fundamental performance and risk-balanced outlook. For long-term, growth-conscious investors seeking resilience and scalable upside, Walmart may offer a reasonable entry point—especially if the company can maintain its digital momentum while defending margins.


Call to Action

Want focused stock breakdowns like this for every major earnings report?
Subscribe now for no-jargon, data-backed posts you can trust.


Disclaimer

This analysis is based solely on Walmart’s official Q1 FY2026 financial report and earnings call transcript. It is not investment advice. Please do your own research before investing.

Leave a comment

Disney Q2 2025 Earnings: Streaming Profits, Theme Park Ambitions—But Is the Stock Already Running Ahead?

Disney Q2 2025 earnings blog post analyzing revenue growth, streaming profitability, and theme park expansion, featuring a full SWOT analysis, stock price impact estimates, and valuation scenarios to guide retail investors.

Quarter Recap: Disney Delivers a Comeback Quarter

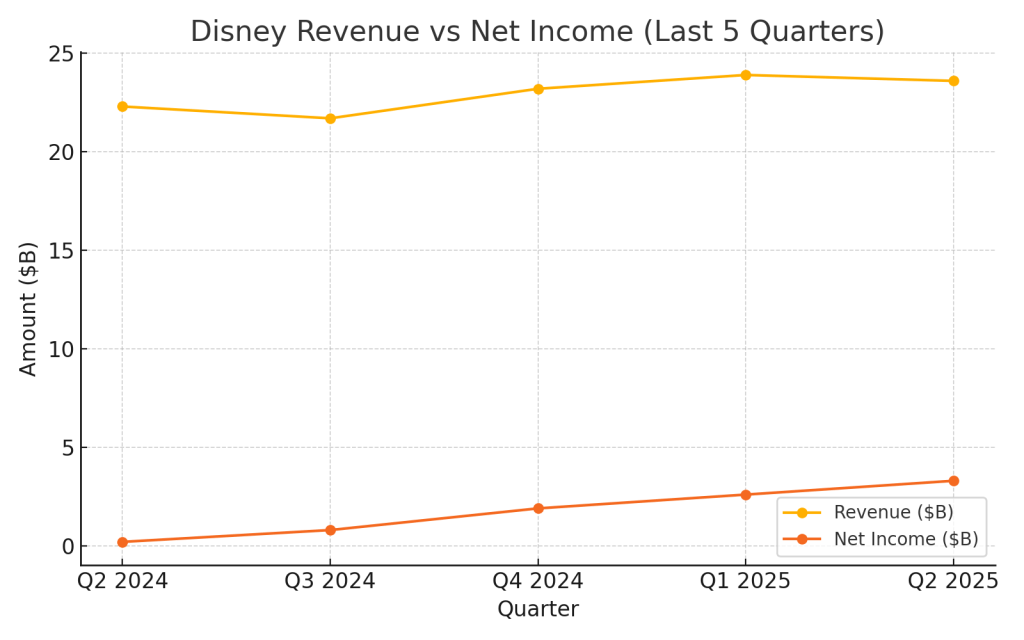
Disney’s (NYSE: DIS) Q2 2025 numbers show it’s more than just nostalgic IP. Revenue came in at $23.6 billion, up 7% from last year. Adjusted EPS hit $1.45—up 20%. Net income surged to $3.3 billion, a massive rebound from the prior year.

Investors liked what they saw. Disney stock jumped nearly 10% after the report dropped, reflecting growing confidence that the company’s turnaround is real.

Two major wins stood out:

  • Streaming operations posted positive income.
  • The Experiences segment (parks, cruises) delivered another strong quarter.
Line chart showing Disney’s revenue and net income over the past five quarters, highlighting a sharp increase in net income during Q2 2025.

Segment Breakdown: Who’s Pulling the Weight

Streaming (Disney+, Hulu, ESPN+)

  • Turned a profit this quarter
  • Subscriber growth continued, though at a steadier pace
  • Bundling and cost control drove the improvement

Experiences (Parks & Cruises)

  • Revenue: $8.9 billion
  • Strong demand in both U.S. and international parks
  • Cruise occupancy and ticket yields improved

Linear Networks (TV/Cable)

  • Continues to shrink
  • Revenue and ad sales declined

Strategic Moves: Where the Magic’s Going

Disney’s not sitting still. Management is investing heavily—planning $60 billion over 10 years to expand its Experiences segment. That includes international projects like a new theme park in Abu Dhabi, upgrades to existing resorts, and cruise capacity expansion.

Streaming is also evolving. A standalone ESPN platform is on the way—positioning Disney to reach sports fans directly without traditional cable. Combined with cost discipline and cross-platform synergy, this is Disney trying to play offense again.


SWOT Analysis: What Could Move the Stock Next

Strengths: Streaming Turnaround and Park Momentum

Disney is now running a profitable streaming business while theme parks continue to print cash. Add global brand power and unmatched IP—this is a combo few can replicate.

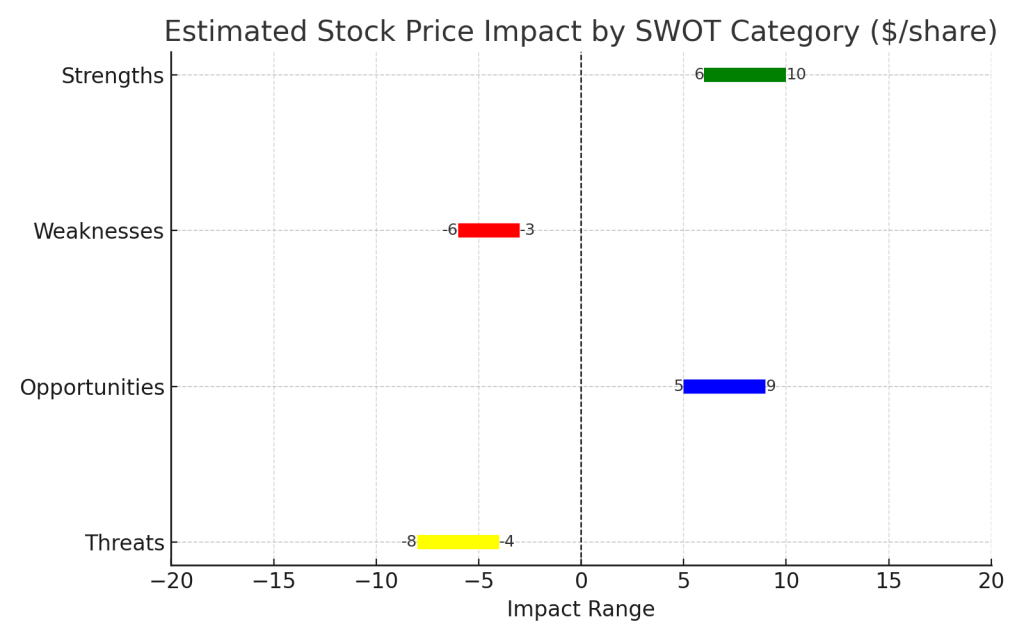
Stock Impact Estimate: + $6 to $10


Weaknesses: Old Media Drag and Content Costs

Linear TV’s decline is structural. Meanwhile, content creation isn’t cheap—especially with high production expectations for Marvel, Star Wars, and beyond. That’s still weighing on margins.

Stock Impact Estimate: – $3 to $6


Opportunities: Global Expansion, ESPN+, IP Leverage

Disney is one of the few entertainment giants that can build both digital and physical experiences. ESPN’s direct-to-consumer rollout and international park projects are growth levers that haven’t fully priced in yet.

Stock Impact Estimate: + $5 to $9


Threats: Macro, Competition, and Saturation

High inflation, consumer fatigue, and stiff competition from Netflix, Amazon, and Apple TV+ are risks. Streaming growth isn’t unlimited, and pricing power may be tested.

Stock Impact Estimate: – $4 to $8


SWOT Summary

Strengths

  • Streaming profitability, parks growth, brand power
  • Impact: +$6 to +$10

Weaknesses

  • Content cost, TV decline, capex pressure
  • Impact: –$3 to –$6

Opportunities

  • Park expansion, ESPN DTC, franchise bundling
  • Impact: +$5 to +$9

Threats

  • Inflation, competition, platform fatigue
  • Impact: –$4 to –$8

Valuation Scenarios: Is the Stock Still Undervalued?

ScenarioTarget PriceAssumptionsProbability
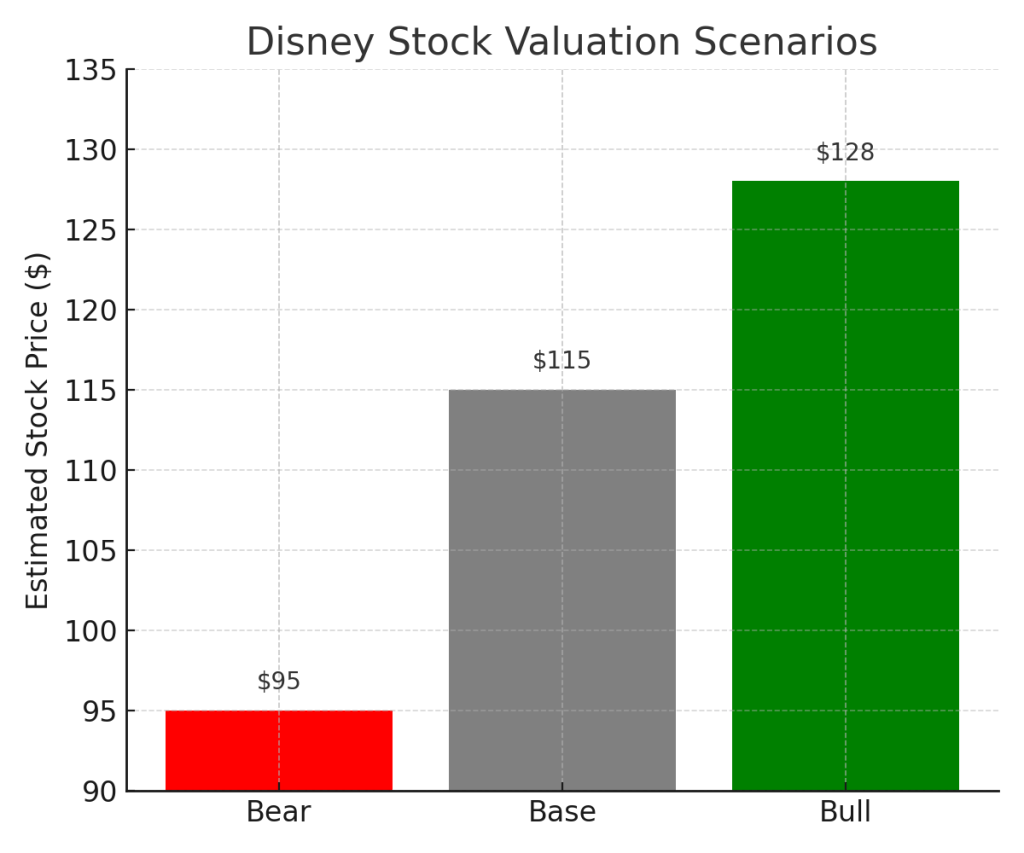
Bull$128Streaming accelerates, parks outperform30%
Base$115Solid execution, steady growth50%
Bear$95Macro slows demand, investments lag20%
Horizontal bar chart illustrating estimated stock price impact by SWOT category for Disney Q2 2025, with strengths and opportunities showing positive influence and weaknesses and threats showing negative impact.

Weighted Fair Value Estimate: $114.90
Current Price: ~$108
(Stock popped ~10% post-earnings but still under fair value)


How Disney Stacks Up vs Rivals

  • Netflix: Still bigger in subscribers, but less diversified—no theme parks or physical cash engines
  • Amazon & Apple: Use streaming to support other businesses. Disney is the content and experience business
  • Comcast: More reliant on cable; Disney’s pivot to DTC looks stronger

Final Verdict: Is Disney Stock Still a Buy?

This was a strong quarter. Disney showed it can run a leaner, smarter business while building for the future. Streaming works. Parks are growing. And IP monetization across content, sports, and experiences is just getting started.

The stock is no longer a bargain—but it’s also not overpriced. At ~$108, it’s trading slightly below our fair value estimate. For investors who want long-term exposure to a globally integrated content company, Disney looks like a smart hold with upside.


What to Watch Next

  • ESPN Standalone Launch: Could attract new DTC revenue
  • Subscriber Churn: Especially outside U.S.
  • Next Park Announcement or Capex Update
  • Profitability Trends: Are margins expanding or flatlining?

Call to Action

Like this breakdown?
Follow @SWOTstock on Instagram for real earnings analysis—no hype, no jargon.
And subscribe to stay ahead of the next big earnings move.


Disclaimer

This post is based exclusively on Disney’s official Q2 2025 earnings report and conference call. It does not use analyst projections or third-party commentary. Please do your own research before making investment decisions.


Uber Q1 2025 Earnings: Strong Profits, Bold Plans, But Is the Stock Price Getting Ahead of Itself?

Uber’s Q1 2025 earnings highlighted profitability with a record free cash flow of $2.3 billion, but revenue of $10.13 billion fell short of expectations. The stock declined 2.5%, reflecting investor caution amid a shrinking Freight segment and market volatility. Analysts suggest the stock appears overvalued at current levels.

Summary: Uber’s Q1 2025 Earnings, Stock Price Reaction, and Valuation Insight

Uber’s (NYSE: UBER) Q1 2025 was a win on profitability and user growth, with record free cash flow and rising trip volumes. However, revenue slightly missed Wall Street expectations, and the Freight segment shrank again. Uber’s CEO emphasized strength in consumer demand and platform efficiency, but the stock sold off modestly after the report. Based on Uber’s own financials and guidance, the stock looks moderately overvalued at current levels.


Quarter Recap

Uber reported Q1 2025 revenue of $10.13 billion, growing 14% year-over-year but just shy of the ~$10.2–10.3 billion consensus estimate. Profitability was the highlight: Adjusted EBITDA hit $1.9 billion (up 35% YoY), and free cash flow reached a record $2.3 billion.

CEO Dara Khosrowshahi called this a quarter of “profitable growth at scale,” highlighting rising trip demand, product stickiness, and expansion in both Mobility and Delivery. He credited Uber’s investments in shared rides, Uber Reserve, and autonomous vehicle partnerships as key long-term bets now starting to show traction.

Why this quarter matters: Uber proved it can grow while generating strong free cash flow—but the market reaction shows expectations are already high.


Key Highlights

  • Revenue: $10.13B (+14% YoY, slight miss vs. ~$10.2B consensus)
  • Adjusted EBITDA: $1.9B (+35% YoY)
  • Free Cash Flow: $2.3B (record high)
  • Trips: 3.0B (+18% YoY)
  • Monthly Active Platform Consumers (MAPCs): 170M (+14% YoY)
  • Freight Gross Bookings: –2% YoY
  • FX Headwind Impact: –$1.7B to Gross Bookings
  • Post-Earnings Stock Reaction: Stock declined ~2.5% to $83.65 on May 7
Uber Q1 2025 revenue and net income trend over five quarters showing consistent profitability growth.

SWOT Analysis

Let’s break it down using the simple SWOT framework—what’s working, where Uber is vulnerable, where future upside could come from, and what risks could spoil the party.

Strengths

Uber’s strong operational leverage is clear. Trips rose 18%, MAPCs grew 14%, and profitability surged. Management emphasized consistently high user retention, growing use of Uber Reserve, and a broader footprint across suburban areas.

CEO Dara Khosrowshahi: “We kicked off the year with yet another quarter of profitable growth at scale.”

Estimated stock impact: +6 to +8 USD


Weaknesses

Despite the upbeat tone, Uber missed revenue expectations, and the Freight segment declined again. Currency headwinds shaved $1.7 billion from Gross Bookings, highlighting exposure to macro volatility.

Management note: Freight volumes remain challenged amid ongoing softness in global logistics.

Estimated stock impact: –2 to –3 USD


Opportunities

Uber’s expansion into suburban cities, growing advertising business, and rollout of autonomous vehicle services create major long-term growth levers. The partnership with Waymo in Austin is already operating at higher utilization than many human drivers.

Management outlook: “We’re on track to expand Uber Reserve, scale AV operations across multiple U.S. cities, and grow our ads business to $1 billion annually.”

Estimated stock impact: +4 to +6 USD


Threats

Uber cited FX volatility and macro uncertainty, particularly a slowdown in airport trips, as external headwinds. While they didn’t reference Ukraine or tariffs explicitly, the global environment remains a risk—especially with international expansion and AV regulatory hurdles ahead.

CFO comment: “We expect FX headwinds of about 1.5% in Q2. Global conditions remain dynamic.”

Estimated stock impact: –3 to –5 USD

Uber Q1 2025 estimated stock price impact by SWOT category: strengths, weaknesses, opportunities, and threats.

SWOT Summary Table (Mobile-Friendly)

CategoryDetailsEst. Stock Impact (USD)
StrengthsTrip growth, record free cash flow, consistent retention+6 to +8
WeaknessesFreight decline, FX headwinds, revenue miss–2 to –3
OpportunitiesAV expansion, Uber Reserve, delivery ads, grocery growth+4 to +6
ThreatsMacro slowdown, FX risk, regulation, valuation pressure–3 to –5

Valuation Scenarios

Based on these factors and company guidance, here’s how Uber’s stock could play out over the next 6–12 months:

ScenarioSummaryValuationProbability
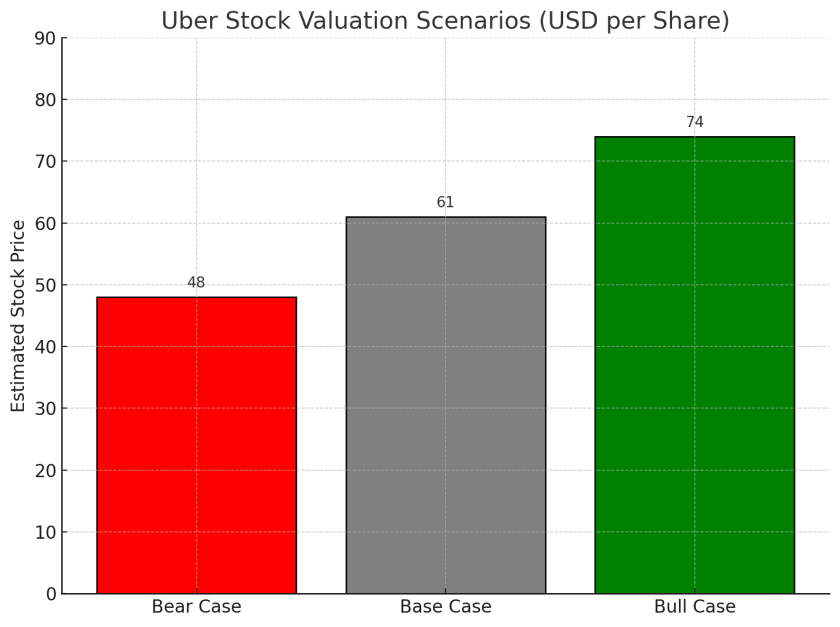
Bull CaseAV expansion accelerates, international growth drives margin gains$7425%
Base CaseSolid execution, stable margins, FX impact manageable$6155%
Bear CaseGlobal slowdown + regulatory drag reduce upside$4820%

Weighted Average Valuation

(74 × 0.25) + (61 × 0.55) + (48 × 0.20) = $61.65

Current price (as of May 10): $82.81

Uber stock price valuation scenarios for Q1 2025 with base, bull, and bear case estimates.

Verdict

Uber’s financial performance is impressive—but the stock is already pricing in much of the good news. At nearly $83, it’s trading ~34% above the base case valuation of $61.65, suggesting limited upside without a major re-rating from AV or international expansion.

Conclusion: Overvalued for now. Strong execution, but patience may pay off.


Call to Action

Enjoying these deep dives into earnings?
Subscribe now to get simple, structured stock breakdowns — powered by real earnings data, not hype.

Also check out our recent breakdowns of Amazon Q1 2025, Meta Q1 2025, and Alphabet Q1 2025 for more actionable insights.


Disclaimer

This post is based solely on Uber’s official Q1 2025 financial report and earnings call transcript.
It is not investment advice. Always do your own research or consult a financial advisor before investing.


Leave a comment