
TL;DR – Solid Beat, Upgraded Guidance, But Market Unmoved
Autodesk (NASDAQ: ADSK) beat expectations in Q1 with 15% revenue growth, expanding margins, and strong free cash flow. Management raised full-year guidance and highlighted its AI platform roadmap. Still, the stock stayed flat—suggesting the optimism may be fully priced in.
Financial Overview – Growth That Converts to Cash
Autodesk reported:
- Revenue: $1.63B (+15% YoY)
- EPS (Non-GAAP): $2.29
- Operating Margin: 37% (+300bps YoY)
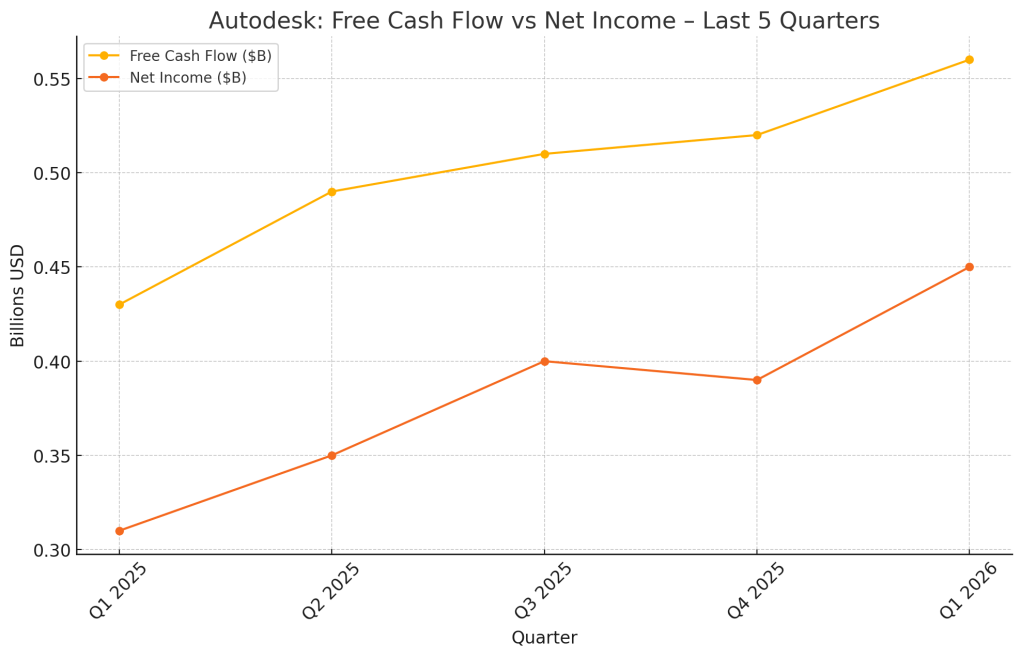
- Free Cash Flow: $556M (+14%)
- Billings: $1.43B (+29%)
- FY2026 guidance raised for revenue and EPS
What sets Autodesk apart isn’t just strong revenue—it’s the ability to consistently convert earnings into cash flow.
Where the Growth Is Coming From
Revenue isn’t growing evenly across all business lines. Autodesk’s AEC (architecture, engineering, and construction) segment remains dominant, but Manufacturing and “Others” are catching up.

Also critical is the mix of recurring revenue. Subscription ARR is expanding steadily, which supports long-term valuation multiples.

Management’s Outlook – Confidence Backed by Upward Revisions
Autodesk has shown a pattern of raising guidance, reinforcing investor confidence in leadership and execution.

SWOT Breakdown – What’s Working, What’s Not, and Where We Go Next
Let’s break it down using SWOT—strengths, weaknesses, opportunities, and threats—with estimated stock price impact for each:
Strengths
- Revenue and FCF beat expectations
- AI rollout begins across Revit and Fusion
- Subscription model fuels predictable growth
Price Impact: +$15 to +$20
Weaknesses
- Flat stock reaction post-earnings suggests limited short-term upside
- High R&D spend during platform transition could compress near-term margins
Price Impact: –$5 to –$10
Opportunities
- Generative design and predictive modeling features gain traction
- Construction Ops platform and APAC expansion could drive new growth
- Increased ARR could unlock multiple expansion
Price Impact: +$25 to +$40
Threats
- Geopolitical and macro headwinds
- Execution risk with AI and Cloud scale
- Valuation already rich (~30.7x forward earnings)
Price Impact: –$20 to –$30
SWOT Summary Table
| Type | Key Points | Price Impact |
|---|---|---|
| Strengths | Revenue & margin beat, AI rollout started | +$15 to +$20 |
| Weaknesses | Flat stock, platform costs | –$5 to –$10 |
| Opportunities | Generative design AI, platform growth, APAC expansion | +$25 to +$40 |
| Threats | Macro risk, AI execution gaps, valuation pressure | –$20 to –$30 |

Valuation Scenarios – Let’s Do the Math
Despite the strong report, Autodesk’s closing price after earning released ($295.35 as of May 23, 2025) implies a ~30.7x forward P/E. Here’s how that compares to valuation scenarios based on official EPS guidance and fair multiples:
Base Case – Fair Value: $132
- EPS = $9.62 × P/E 13.7 → $132
- Reflects steady execution and moderate optimism
Bull Case – Fair Value: $160
- EPS = $9.73 × P/E 16.5 → $160
- Assumes strong AI traction and margin expansion
Bear Case – Fair Value: $100
- EPS = $9.50 × P/E 10.5 → $100
- Macro pressure + execution delays = multiple compression
Weighted Average Estimate: $132.5
(132×0.6)+(160×0.25)+(100×0.15)=132.5

So Why Is the Market Paying $295?
That’s nearly double our base case. Investors are pricing in:
- Premium for platform dominance and design ecosystem
- Long-term AI monetization potential
- Confidence in 3–5 year growth, not just FY2026
Let’s check historical valuation to see if this premium is new.

Verdict – Fully Valued. Wait for Dip.
Autodesk’s vision is impressive. The stock is too.
But at current prices, the upside may already be realized—at least in the short term. Long-term investors may want to hold. Opportunists should consider waiting for a pullback below $250 to improve margin of safety.
Call to Action
Want no-hype, investor-friendly breakdowns like this?
Subscribe to SWOTstock to stay ahead of the curve—no fluff, just fundamentals.
Disclaimer
This post is based solely on Autodesk’s official financial report and earnings call transcript. It does not constitute investment advice. Please do your own research.

Leave a comment