🏦 JPMorgan Q2 2025 Earnings — A Value Anchor in a Rate-Driven Storm

PMorgan’s Q2 2025 earnings beat expectations with 21% ROTCE, strong trading revenue, and raised NII guidance. Read our full SWOT analysis, fair value breakdown, and how JPM compares to Citi and Wells Fargo.

📌 TL;DR

JPMorgan (NYSE: JPM) delivered a strong Q2 with a solid earnings beat and raised full-year guidance, returning $11B to shareholders. While the stock barely moved, long-term value remains intact. DIY investors should watch for dips below $285.


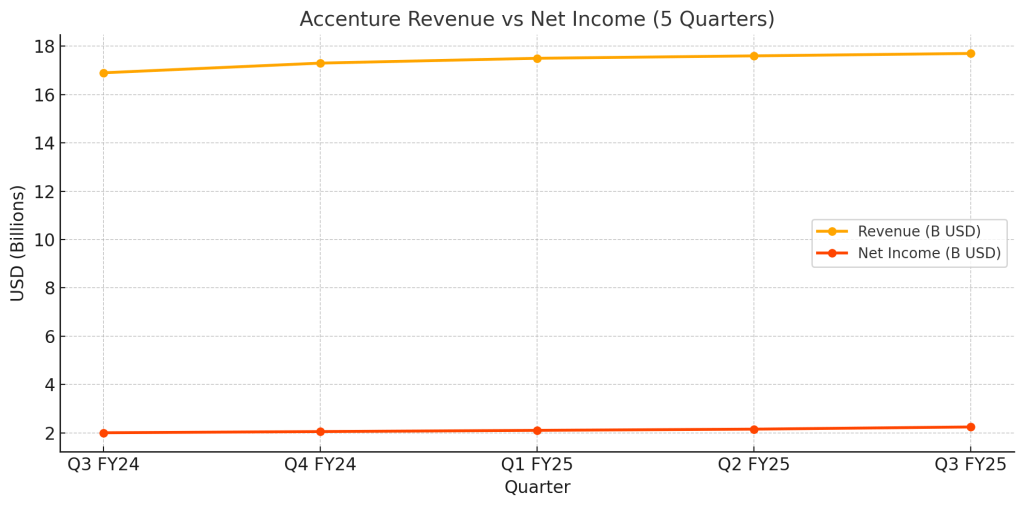
📆 Q2 2025 Recap — Earnings Beat, Capital Strength

JPMorgan’s Q2 2025 performance was a masterclass in disciplined execution. The bank delivered an 11% EPS beat, maintained a stellar 21% ROTCE, and raised its full-year NII guidance—despite a revenue drop tied to tough comps from the prior year. Business segments like investment banking and trading outperformed, while capital return to shareholders remained robust with $11B distributed in just one quarter. This level of consistency and balance is exactly what long-term value investors look for.

Earnings highlights (July 15 release):

  • 🧾 EPS: $4.96 (vs $4.48 est), +11% beat
  • 💰 Net income: $15.0B (or $14.2B excl. tax benefit)
  • 📉 Revenue: $45.7B, down 10% YoY (due to Visa gain comp)
  • 💸 Capital Return: $3.9B in dividends + $7.1B in buybacks
  • 📈 ROTCE: 21% (20% adjusted)

Corporate & Investment Bank (CIB):

  • Net income: $6.7B, +13% YoY
  • Dealmaking fees: $2.5B, +7% YoY
  • Markets revenue: +15%, led by fixed income

📊 FY NII guidance raised: $95.5B (previously ~$94B)

Line chart showing JPMorgan's revenue and net income over the past five quarters from Q2 2024 to Q2 2025, highlighting strong Q2 2025 earnings performance.

📉 Market Reaction — Earnings Beat, Flat Price

JPM closed at $286.55, down ~0.3% on earnings day.

Despite delivering an impressive earnings beat and raising its full-year NII guidance, JPMorgan’s stock barely budged—closing the day slightly lower. The muted reaction puzzled many, but it likely reflects broader market caution rather than company-specific weakness. Investors may be focusing on rising expense trends, margin pressure from anticipated rate cuts, or simply digesting mixed signals from the banking sector as a whole. In other words, the fundamentals impressed—but sentiment lagged behind. For long-term investors, that disconnect may represent an opportunity.

  • YoY revenue drop from one-offs
  • Core expenses rising 5% YoY
  • Margin pressure from rate cuts

🧠 Jamie Dimon cautioned on “geopolitical instability, unsustainable fiscal deficits, and central bank pressure.”


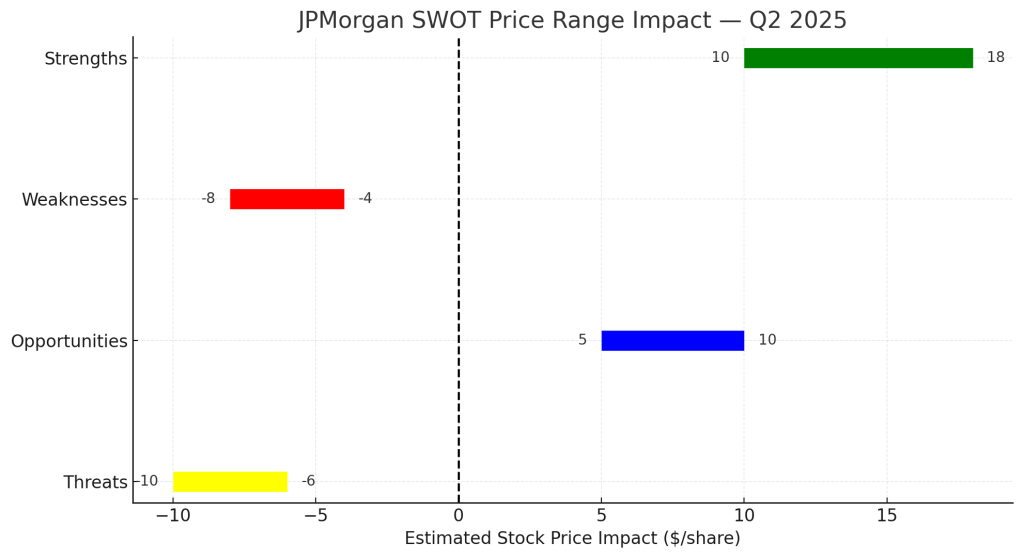
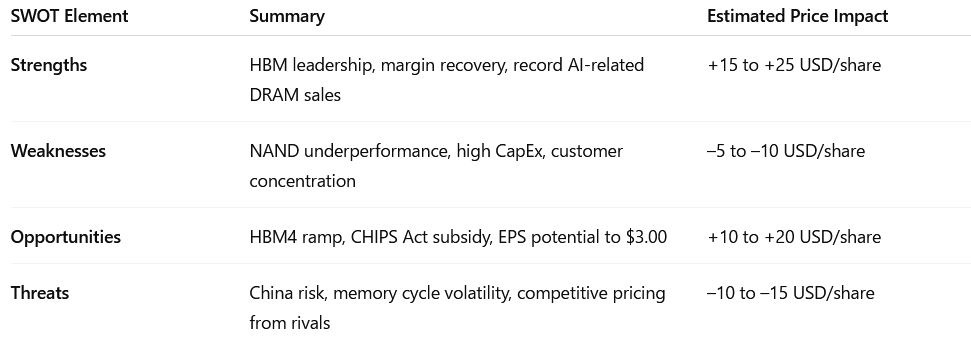
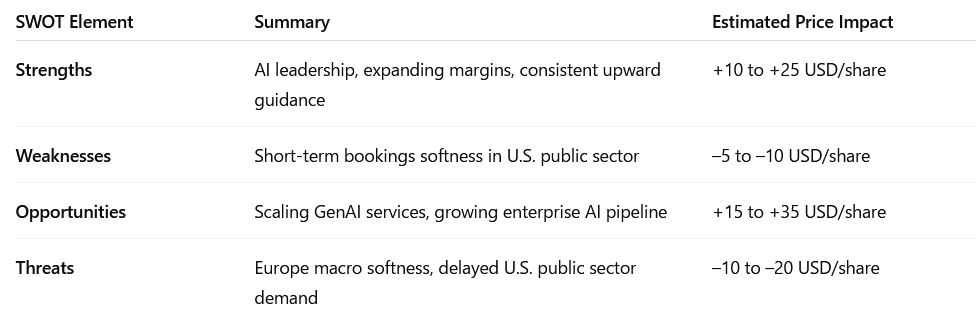
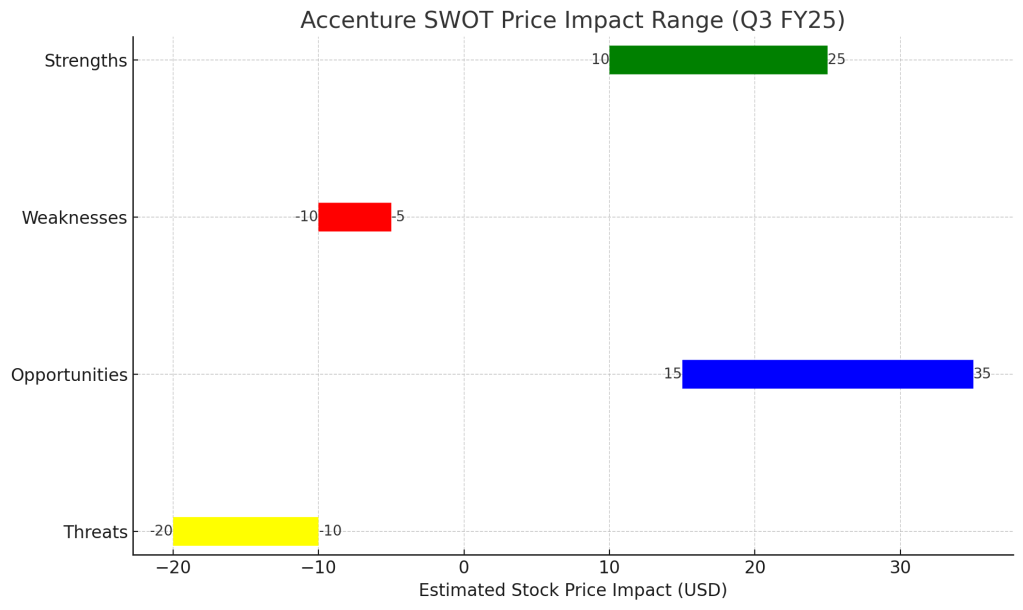
🧠 SWOT Analysis with Price Ranges

To make sense of JPMorgan’s positioning, we broke down the quarter using our dollar-anchored SWOT framework. This isn’t just a list of talking points—it’s a tool to map potential price impacts. Strengths like high ROTCE and capital discipline support the upside, while expense growth and macro risk could pull against it. The result? A snapshot of both opportunity and risk that’s grounded in the fundamentals, not speculation.

Horizontal bar chart showing JPMorgan's SWOT analysis with estimated stock price impact ranges for Q2 2025. Strengths and Opportunities show upside potential, while Weaknesses and Threats show downside risks.
SWOT table summarizing JPMorgan's strengths, weaknesses, opportunities, and threats for Q2 2025, with estimated stock price impact ranges for each factor.

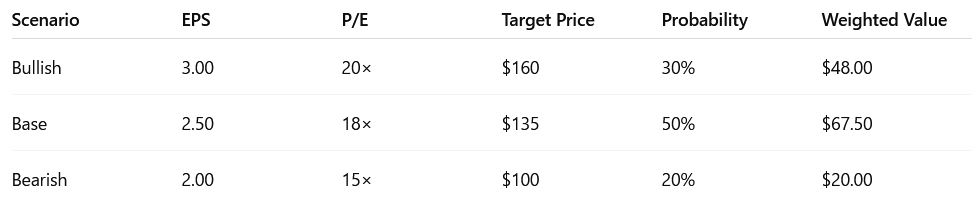
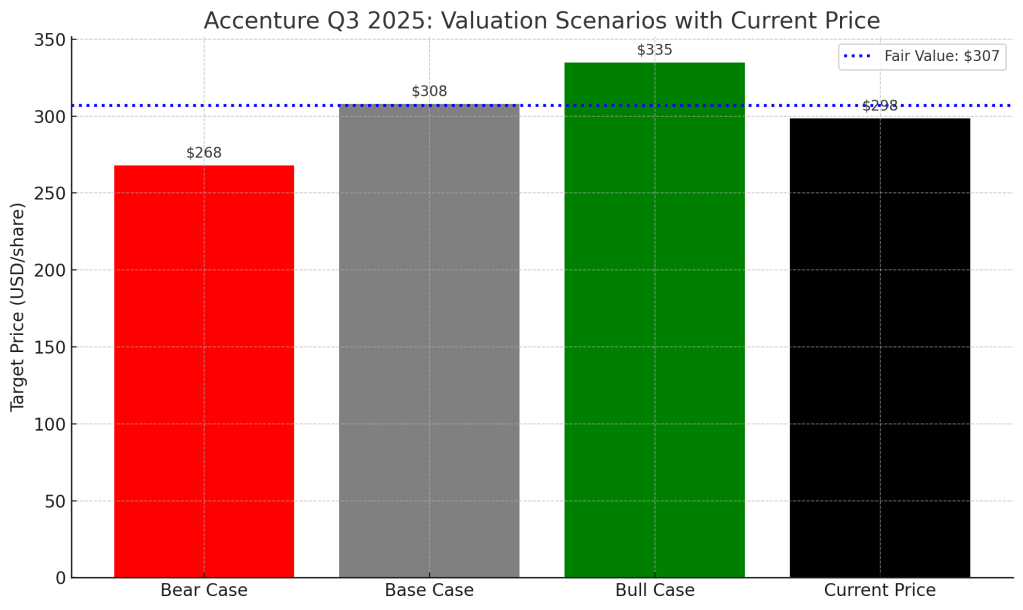
📊 Valuation Scenarios

JPMorgan’s current share price sits just below our estimated fair value—but the path ahead depends on how macro and internal drivers unfold. In our model, we outline three scenarios: a bull case driven by continued earnings strength and compounding tech investments; a base case reflecting stable profitability; and a bear case factoring in rate compression and regulatory drag. We assign probabilities to each and arrive at a weighted fair value—offering a disciplined way to anchor expectations.

Vertical bar chart showing JPMorgan's bull, base, bear case target prices and current stock price for Q2 2025, with a dotted line indicating the fair value estimate.
Table showing JPMorgan’s Q2 2025 bull, base, and bear case price targets with associated probabilities and a calculated fair value estimate.

🔍 JPM vs Peers (Q2 2025 Snapshot)

What sets JPMorgan apart isn’t just the size of its balance sheet—but how efficiently it runs. Compared to Citi and Wells Fargo this quarter, JPM led in ROTCE, delivered solid beats, and even raised guidance. Meanwhile, peers either maintained or cut forecasts. The market’s muted response to JPM’s beat may have more to do with sector fatigue than actual fundamentals. The data tells a clearer story.

Comparison table of JPMorgan, Citigroup, and Wells Fargo showing Q2 2025 metrics including ROTCE, EPS surprise, NII guidance direction, and stock price reaction.

→ JPM’s valuation remains more attractive vs peers with stronger capital efficiency.


✅ Verdict — Value with a Margin of Safety

For value-focused investors, JPMorgan continues to check the boxes: high ROTCE, strong dividend yield, and durable earnings. The muted stock reaction creates an opening—not for hype-driven gains, but for steady compounding. With shares trading just below our fair value estimate, the risk-reward profile remains favorable. If your investing playbook includes buying quality on dips, JPM still earns a spot near the top of the list.

  • Strong ROTCE and stable capital return
  • Resilient fee-based businesses (trading, IB, payments)
  • Undervalued at current price with room for compounding

Buy range: Below $285
Fair value: $290–$295
Dividend yield: ~2.0%
5-Year Dividend CAGR: ~8.6%


📣 Why Subscribe to SWOTstock?

If you found this analysis useful, don’t just bookmark it—subscribe. At SWOTstock, we break down every major earnings report using only official numbers, structured insights, and investor-first language. No hype, no jargon. Just clear, actionable takeaways built for long-term thinkers. Whether you’re tracking your portfolio or building conviction, you’ll get the clarity you need—right when it matters most.


📬 Official-sourced only.
📉 No hype. Just facts.
📈 Fair value + SWOT + Visuals in every post.

👉 Subscribe now and get value investor reports delivered weekly.


⚠️ Disclaimer

This content is provided for informational and educational purposes only and does not constitute investment advice, a recommendation, or an offer to buy or sell any securities. All analysis is based solely on publicly available financial reports and official company statements. Always conduct your own research or consult with a licensed financial advisor before making investment decisions. The authors of this post may hold positions in the companies mentioned.


Leave a comment


Micron Is Back in the Game: Q3 2025 Proves AI Demand Is Real — But Is the Stock Still a Buy?

Micron’s Q3 FY2025 earnings reveal a strong AI-driven rebound with record DRAM sales, margin expansion, and rising profitability. Explore our SWOT analysis, valuation scenarios, and stock price outlook based solely on official financials and management commentary.

TL;DR Summary

Micron (NASDAQ:MU) reported blockbuster Q3 FY2025 earnings, fueled by explosive growth in AI memory demand — especially for high-bandwidth memory (HBM), which exceeded $1 billion for the quarter and is already sold out for 2025. With EPS of $1.91 and Q4 guidance pointing even higher, Micron is making a strong case for a rerating. Our updated fair value estimate is $135.50, implying modest upside from current levels, but more importantly, confirming Micron’s transition from cyclical to structural relevance in the AI build-out.


Quarter Recap: A Turning Point in the Cycle

For years, Micron has lived and died by the memory cycle. But Q3 FY2025 feels different. The company reported its highest-ever quarterly revenue at $9.3 billion, a 37% year-over-year increase. DRAM led the charge, generating $7.1 billion, while HBM demand — largely driven by AI servers — grew over 50% quarter-over-quarter and surpassed $1 billion for the first time. Management confirmed that all HBM supply is committed through the end of 2025, signaling not just demand, but pricing power.

Gross margin came in at 39% (non-GAAP), and EPS surged to $1.91, up from a loss just one year ago. More importantly, free cash flow turned decisively positive at $1.95 billion, providing flexibility for both investment and shareholder return.

Micron also reaffirmed its long-term strategic positioning with a $200 billion commitment to U.S. manufacturing and R&D under the CHIPS Act. This isn’t just a bounce-back quarter — it looks like a foundation for a new phase of sustained growth.

Line chart showing Micron’s revenue and net income over the past five quarters. Revenue steadily rises from $3.75 billion in Q3 FY24 to $9.30 billion in Q3 FY25. Net income starts at –$1.9 billion, remains negative until Q1 FY25, then turns positive in Q2 FY25 and reaches $1.89 billion in Q3 FY25. The chart includes a horizontal dashed line at zero to mark the breakeven point.

What’s Fueling the Momentum?

The key driver is unmistakably AI. As hyperscalers expand their infrastructure to support large language models and enterprise AI deployments, demand for advanced memory — particularly HBM and DDR5 — has exploded. Micron’s unique position as one of just a few players in this space is enabling it to lock in customers at strong margins.

But it’s not just the top line that’s improving. Operating leverage is finally kicking in. Inventory days are falling, CapEx is normalizing, and the company’s balance sheet is healthy with over $27.9 billion in total liquidity. For growth investors watching this space, Micron is beginning to look like a structurally profitable company, not just a cyclical memory supplier.

Stacked bar chart showing Micron’s DRAM and NAND revenue over the last five quarters. DRAM revenue increases from $2.75 billion in Q3 FY24 to $7.10 billion in Q3 FY25. NAND revenue grows from $1.00 billion to $2.20 billion over the same period. DRAM consistently contributes the larger share of total revenue, with a noticeable acceleration starting in Q1 FY25

SWOT Analysis: Breaking Down the Fundamentals

Rather than relying on sentiment or social media buzz, let’s unpack the key forces driving Micron’s stock — both good and bad — based on official data and management commentary.

Bar chart showing estimated stock price impact ranges for Micron Q3 FY2025 by SWOT category. From top to bottom: Strengths range from +15 to +25 USD, Weaknesses from –10 to –5 USD, Opportunities from +10 to +20 USD, and Threats from –15 to –10 USD. Bars are color-coded green, red, blue, and yellow respectively. The x-axis ranges from –20 to 25 USD per share, indicating estimated contribution to Micron’s stock price from each factor.

Strengths (+$15 to +25/share)

Micron’s execution in AI memory is the real story. HBM revenue not only topped $1B but is fully booked through next year. The 1-gamma DRAM node — with 30% density and 20% power improvements — is entering early production, providing a margin and performance edge.

Weaknesses (–$5 to –10/share)

Despite DRAM’s strength, NAND continues to underperform (+4% YoY), and high CapEx levels weigh on near-term cash conversion. There’s also concentration risk — a handful of cloud customers drive a significant portion of revenue.

Opportunities (+$10 to +20/share)

With CHIPS Act funding unlocking domestic capacity and HBM4 set to launch, Micron has multiple ways to extend its lead. If FY26 EPS trends toward $3.00, the market may rerate MU toward a higher earnings multiple.

Threats (–$10 to –15/share)

AI cycles are notoriously hard to predict. Any slowdown in server buildouts, export restrictions to China, or aggressive pricing from Samsung and SK Hynix could compress Micron’s margins and reduce upside.

📊 Micron Q3 FY2025 SWOT Summary

SWOT summary table for Micron Q3 FY2025 showing four categories: Strengths include HBM leadership and margin recovery with an estimated impact of +15 to +25 USD/share; Weaknesses include NAND underperformance and high CapEx with an impact of –5 to –10 USD/share; Opportunities highlight the HBM4 ramp and CHIPS Act subsidy with +10 to +20 USD/share impact; Threats note China risk and competitive pricing pressure with –10 to –15 USD/share impact.

Valuation Scenarios: Calculating What It’s Worth

Based on Micron’s own forward guidance, historical multiples, and a fair risk-adjusted outlook, here’s how we frame the valuation:

Valuation scenarios table for Micron Q3 FY2025. The bullish case assumes $3.00 EPS and 20× P/E for a $160 target, with 30% probability and $48 weighted value. The base case uses $2.50 EPS and 18× P/E for a $135 target, with 50% probability and $67.50 weighted value. The bearish case assumes $2.00 EPS and 15× P/E for a $100 target, with 20% probability and $20 weighted value. The probability-weighted fair value estimate is $135.50 per share.

🎯 Fair Value Estimate:

$48.00 + $67.50 + $20.00 = → $135.50/share
📉 Current Price (as of June 26): ~$127.25
📈 Implied Upside: ~6.5%

Bar chart showing Micron’s Q3 FY2025 valuation scenarios. Bear case target is $100 (red), base case is $135 (gray), bull case is $160 (green), and current stock price is $127 (black). A dotted blue line marks the calculated fair value at $136. The chart illustrates relative upside potential under different earnings scenarios.

Peer Context: How Does Micron Stack Up?

Micron’s 39% gross margin now rivals Samsung’s memory division but still trails SK Hynix’s HBM-focused business, which has hit margins north of 45%. However, Micron’s consistent EPS acceleration — paired with a cleaner balance sheet and U.S. production capacity — could justify a premium multiple in future quarters.

Bar chart comparing gross margins of major memory players for Q3 FY2025. Micron has a 39% gross margin, SK Hynix leads with 45%, and Samsung’s memory division reports 40%. The chart highlights Micron’s competitive positioning, slightly behind its Korean peers in profitability.

What to Watch Next Quarter

  1. HBM4 Ramp-Up: Will Micron maintain pricing power as next-gen chips hit production?
  2. CapEx Discipline: Is investment tapering enough to keep FCF positive?
  3. AI Demand Stickiness: Does server spending hold up into year-end?

Verdict: Hold to Accumulate

Micron is no longer just a cyclical memory stock — it’s emerging as a core infrastructure provider for the AI era. At today’s price around $127, the stock offers a balanced risk-reward profile with clear near-term momentum and longer-term optionality. For tech-savvy growth investors, this is a name to hold and continue accumulating on dips — not chase blindly, but don’t look away either.


Call to Action

If you’re tracking AI infrastructure plays and want insights backed only by the official data — not clickbait — follow SWOTstock or subscribe for the next update.


Disclaimer

This post is for informational purposes only. All analysis is based solely on Micron’s official Q3 FY2025 financial report and earnings call transcript. No third-party data or analyst commentary was used.


Leave a comment


Accenture Stock After Q3 2025: Why the Pullback Could Be a Buying Opportunity

Accenture Q3 FY25 earnings: AI growth accelerates, stock dips on bookings miss. SWOT analysis, valuation & buy opportunity for long-term investors.


TL;DR — Should You Buy Accenture Stock After Q3 Earnings?

Accenture (NYSE: ACN) posted a strong Q3 FY2025, delivering 8% revenue growth, 15% EPS growth, and another upward revision to its full-year guidance. Its AI-led transformation is gaining pace, with $1.5 billion in generative AI (GenAI) bookings this quarter alone. Yet the stock pulled back about 4% intraday after the report, as total bookings came in softer than expected, particularly in U.S. public sector work. Our updated valuation suggests fair value around $307 per share. For long-term growth investors, this earnings-driven dip could be an opportunity to accumulate shares.


Quarter Highlights — Q3 FY2025

  • Revenue: $17.7 billion (+8% YoY)
  • EPS: $3.49 (+15% YoY)
  • Operating Margin: 16.8% (+80bps YoY)
  • Free Cash Flow: $3.5 billion
  • Dividend: Increased 15% to $1.48/share
  • Share Buybacks: $1.8 billion
  • GenAI Bookings: $1.5 billion
  • Total Bookings: $19.7 billion (–6% YoY)
  • FY25 Guidance (raised): Revenue growth 6–7%, EPS $12.77–12.89, FCF $9.0–9.7 billion
Line chart showing Accenture’s revenue and net income across the last five quarters, with revenue steadily growing and net income gradually rising.

Market Reaction — Why Did ACN Stock Dip?

Despite an otherwise strong quarter, Accenture stock dipped approximately 4% after the report, closing around $298.50 per share. The primary reason was softer total bookings, which declined 6% year-over-year. Management explained that this was due to delays in U.S. federal contract awards — not a sign of broader demand weakness. Given Accenture’s recent rally and premium valuation, the bookings miss triggered near-term profit-taking. The options market had priced in a ±5.3% earnings move, roughly matching the post-report volatility.


AI-Led Transformation Gaining Momentum

The bigger story remains Accenture’s pivot toward AI. The company booked $1.5 billion in GenAI-related deals this quarter, with over 30 major clients scaling adoption. A new “Reinvention Services” unit was launched to drive AI-led business transformation, and more than 500,000 employees have been trained in AI capabilities. Compared to peers such as IBM, Capgemini, and Deloitte, Accenture is moving faster and at greater scale. Management also pointed to a growing multi-year pipeline of AI services heading into FY26.


Analyst Ratings & Market Sentiment

Currently, 8 of 11 analysts covering Accenture stock rate it a “Buy,” with a consensus target of $357 per share. While the bookings softness raised some short-term caution, the long-term bullish case remains intact. Options markets indicate ongoing volatility, but investor confidence in Accenture’s AI strategy is growing.


Regional Trends — Q3 FY25

North America continues to lead, with strong AI and cloud demand driving revenue to approximately $8.9 billion. Europe remains mixed, with public sector softness balanced by growth in the UK and Nordics, contributing around $5.2 billion. Asia Pacific is accelerating, led by AI adoption in Japan and Southeast Asia, reaching about $3.6 billion.


Outlook Beyond FY25

Management expects GenAI revenue growth to accelerate into FY26 and beyond. Multi-year AI services pipelines are expanding, and the mix shift toward higher-margin AI offerings should support continued EPS growth and potential valuation re-rating. For long-term investors, this positions Accenture as one of the top large-cap beneficiaries of enterprise AI adoption.


SWOT Analysis — Accenture Stock After Q3 FY25

Strengths: Leadership in AI services, expanding margins, and consistent upward revisions to guidance provide valuation upside of $10 to $25 per share.

Weaknesses: Short-term bookings softness in the U.S. public sector presents a near-term headwind of approximately –$5 to –$10 per share.

Opportunities: Scaling GenAI services and a growing pipeline of large enterprise AI deals could contribute $15 to $35 per share in valuation upside.

Threats: Macroeconomic headwinds, especially in Europe and delayed U.S. public sector demand, may pose downside risk of –$10 to –$20 per share.

SWOT summary table for Accenture stock after Q3 FY25 earnings: Strengths include AI leadership and margin growth; Weaknesses are short-term bookings softness; Opportunities from scaling GenAI services; Threats include European macro softness and delayed U.S. federal spending.

SWOT Price Impact Chart

Horizontal thick bar chart showing SWOT price impact ranges for Accenture stock after Q3 FY25: Strengths +10 to +25 USD, Opportunities +15 to +35 USD, Weaknesses –10 to –5 USD, Threats –20 to –10 USD.

Valuation Scenarios — Where Is Fair Value?

Valuation scenarios table for Accenture stock after Q3 FY25 earnings: Bear Case $268, Base Case $308, Bull Case $335, with estimated fair value at $307 per share.

Our updated weighted valuation suggests a fair value of approximately $307 per share, with the stock now trading near $298.50.

Bar chart showing Accenture Q3 FY25 valuation scenarios: Bear Case $268, Base Case $308, Bull Case $335, with current price at $298 and fair value estimated at $307 per share.

Should You Buy Accenture Stock Now?

For tech-savvy growth investors, the current pullback presents an attractive opportunity. Accenture is executing well on its AI-first strategy, financial fundamentals remain strong, and the company is building durable AI-driven pipelines for future growth. While short-term volatility remains likely, we view levels below $300 per share as an excellent entry point for long-term holders seeking exposure to enterprise AI transformation.


Final Takeaway

Accenture continues to solidify its leadership in enterprise AI services. The Q3 pullback reflects temporary contract timing issues, not structural demand weakness. As GenAI services scale into FY26 and beyond, we believe Accenture stock offers compelling long-term value for growth-focused investors.


Disclaimer

This analysis is based exclusively on Accenture’s Q3 FY2025 official earnings release and earnings call transcript. It is not financial advice. Investors should conduct their own due diligence.


Leave a comment