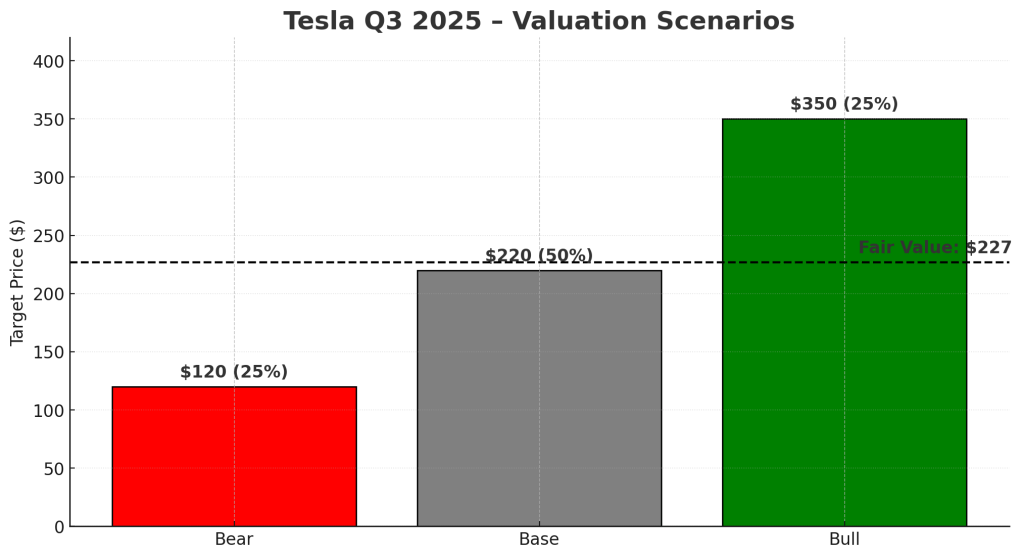
Tesla’s Q3 results show record revenue of $25.2 billion and net income of $2.1 billion. While margins are recovering, they remain below 2022 levels. The fair value estimate is $227 per share, with current valuation suggesting a hold recommendation. Investors should consider a buy zone around $180-$190.
TL;DR:
Tesla reported record Q3 revenue of $25.2 B (+7.8 %) and net income of $2.1 B (+11 %), but margin recovery remains shallow.
The fair value sits near $227/share — reasonable for holders, not yet a bargain for new buyers.
📊 Quarter Recap
• Revenue $25.2 B (+7.8 %)
• Gross Profit $5.65 B (+13 %)
• Operating Income $2.17 B (+29 %)
• Free Cash Flow $1.47 B (+61 %)
• Auto Gross Margin 19.6 % (↑ 1.3 pts YoY)
Margins have stabilized after two years of price cuts — but at ~19 %, still far below the 25 % peak of 2022.
Each 1 pt margin shift ≈ $1 B impact to net income.
💬 Management Tone
“We’re entering the autonomy era — vehicle hardware is ready.” – Elon Musk
“Capex will rise into 2026 as we ramp Optimus and Dojo.” – CFO
Translation: positive cash flow continues, but the AI and robotics push keeps capex heavy. Patience required.
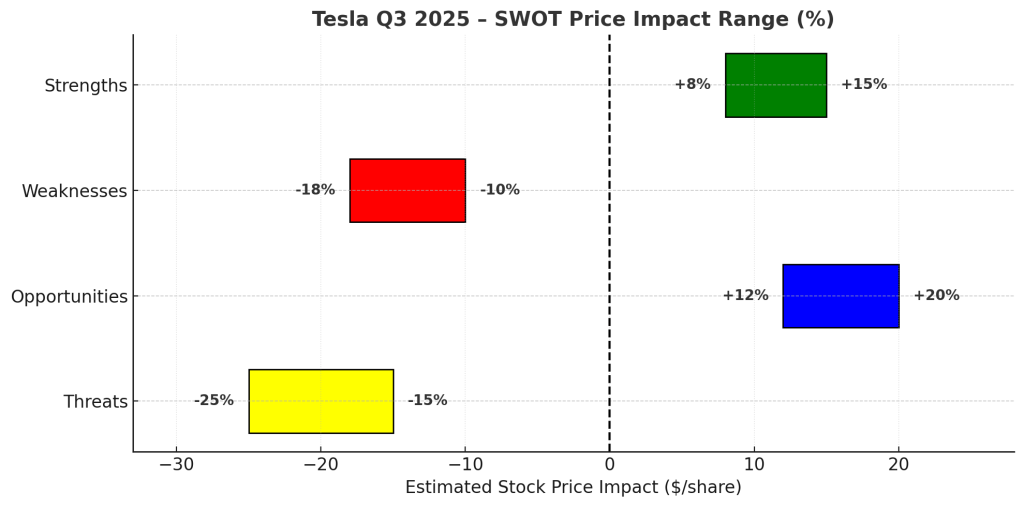
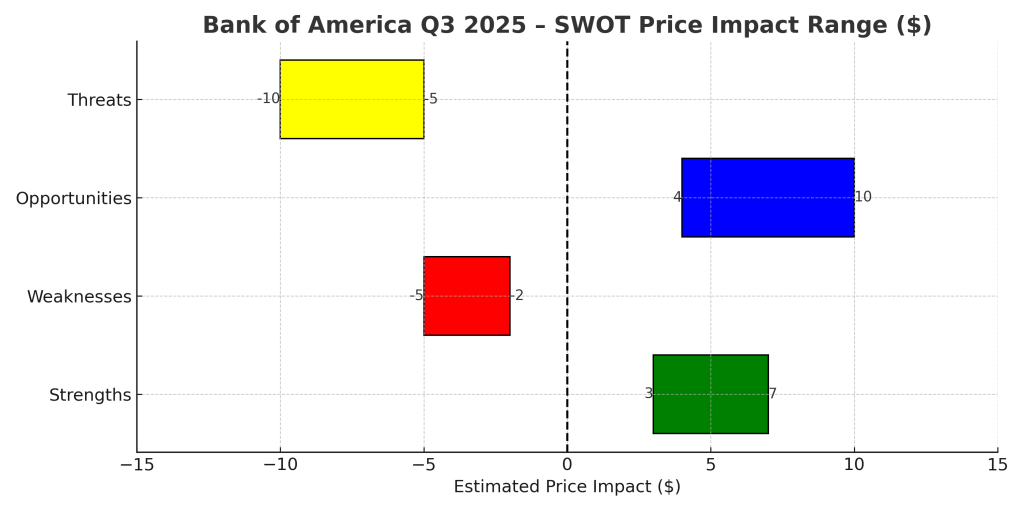
🧩 SWOT Summary (Price Impact Ranges)
Strengths (+8 – 15 %)
– Vertically integrated EV + AI ecosystem
– $25 B net cash cushion
– Sequential margin recovery
Weaknesses (–10 – 18 %)
– Margins well below 2022 levels
– Tariff + mix pressure
– Energy unit still small
Opportunities (+12 – 20 %)
– FSD subscriptions and Dojo compute could add 1–2 pts to margin
Bank of America demonstrated strong Q3 2025 results with an EPS of $1.06 and a net interest income of $15.2 billion, alongside a 43% rise in investment-banking fees. Management’s increased Q4 guidance reflects confidence. The bank’s stability positions it as a reliable choice for value investors amid economic uncertainty.
TL;DR
Bank of America reported a steady and resilient Q3 2025: EPS came in at $1.06, net interest income rose to $15.2 billion, and investment-banking fees jumped 43%. Management also raised Q4 NII guidance, signaling confidence heading into year-end. After the release, the stock traded roughly 2–3% higher, reflecting a market that values stability in a choppy macro environment. For DIY value investors, this quarter underscores BofA’s role as a dividend-reliable, moderately undervalued financial anchor rather than a high-beta trade.
Quarter Recap
Bank of America delivered a steady and confident performance in Q3 2025, leaning more on disciplined execution than dramatic surprises. Net income reached $8.5 billion, translating to $1.06 per share, comfortably above expectations and supported by $15.2 billion in net interest income that remained resilient despite shifting rate dynamics. Management emphasized that positive operating leverage reflected tighter cost control and continued investment in risk management and technology. Capital markets activity added a welcome boost, with investment-banking fees rising 43% as dealmaking and underwriting improved from last year’s lows. Importantly for long-term investors, the bank’s CET1 ratio stayed above 12%, reinforcing its capacity to maintain dividends and pursue selective buybacks even in a more uncertain macro backdrop. Overall, the quarter underscored BofA’s ability to produce stable, repeatable earnings at a time when many peers are navigating more uneven conditions.
Key Highlights
EPS: $1.06, above internal targets and analyst expectations.
Net Interest Income: $15.2B, maintaining upward momentum.
Investment-Banking Fees: +43% YoY, continued rebound in capital markets.
• Prolonged macro uncertainty affecting NII trajectory
Valuation Scenarios (12-Month Outlook)
Using official Q3 performance, NII guidance, and credit commentary:
Bull Case – $56 (+15%)
• Sustained NII strength
• Continued recovery in investment banking
• Flat credit losses into 2026
Base Case – $51.3 (+5%)
• Stable NII
• Moderate fee growth
• Expense discipline maintained
Bear Case – $44 (–10%)
• Margin compression from declining rates
• Credit costs rise toward the historical mean
• CRE pockets worsen
Probability-Weighted Fair Value:
(0.3 x 56) + (0.5 x 51.3) + (0.2 x 44) = approx. $51.1
Verdict
Bank of America continues to deliver what value-focused investors want: predictable earnings, conservative capital management, and a stable dividend.
This quarter didn’t redefine the company—but it didn’t need to.
Instead, it reinforced that BofA’s risk-reward profile is built on durability rather than excitement.
At around $50–51 post-earnings, shares sit close to their $51 fair value, leaving modest upside but strong downside support. For long-term investors comfortable with financial-cycle volatility, BofA remains a hold with opportunistic accumulation on dips below $48.
Call to Action
If you find this style of earnings-driven, valuation-based analysis helpful, follow SWOTstock for more breakdowns across banks, tech, and industrials—always grounded in official filings and management commentary.
Disclaimer
This article is for informational and educational purposes only. It does not constitute investment advice or a recommendation to buy or sell any securities. All analysis is based solely on Bank of America’s official Q3 2025 financial results and publicly available management commentary. Investors should conduct their own research or consult a licensed advisor before making investment decisions.
Cisco’s fiscal 2026 began strongly, with revenue up 8% to $14.9 billion and non-GAAP EPS up 10% to $1.00. Management raised guidance due to AI orders and Splunk integration. Despite this, Cisco trades above historic valuation levels at $74, making it less attractive for value investors seeking bargains.
🧭 TL;DR Summary
Cisco (CSCO:NASDAQ) delivered a strong start to fiscal 2026: revenue rose 8 % to $14.9 billion and non-GAAP EPS jumped 10 % to $1.00. Management raised full-year guidance on accelerating AI-network orders and early progress integrating Splunk. Yet, after the 6 – 8 % post-earnings surge, Cisco trades well above its historic valuation range. For value investors, it remains a reliable dividend engine—but hardly a bargain at $74.
AI-driven switching orders, stronger software renewals, and Splunk integration boosted confidence, while recurring subscription revenue rose to 44 % of total sales—proof that Cisco’s transformation is gaining traction.
🔍 Key Highlights
AI Infrastructure Momentum: Backlog > $1 billion in AI network orders.
Strengths (+8 % to +12 %) Cisco’s expanding recurring-revenue base and tight cost control anchor earnings stability. Its balance sheet is debt-light and supports steady buybacks and dividends—attributes valued by income investors.
Weaknesses (–5 % to –8 %) Hardware still drives over 40 % of sales, leaving results exposed to ordering cycles. Operating cash flow slid 12 %, reflecting inventory timing and working-capital drag. Without transparent AI-revenue reporting and faster cash-conversion, valuation upside is hard to justify.
Opportunities (+10 % to +15 %) AI-infrastructure spending offers a fresh growth lane. The Silicon One platform and Splunk integration can unlock new data and security use cases, while Hypershield subscriptions could lift software margins 1 – 2 points. Execution on these fronts may re-rate Cisco toward 15× earnings.
Threats (–7 % to –10 %) Rivals such as Arista, Palo Alto Networks, and Juniper’s Mist unit are capturing AI-network share faster. Cisco’s portfolio breadth can appear complex to customers seeking simpler cloud-native solutions. Macro slowdown or AI-capex pause would test both hardware and optics segments.
Most probable path given guidance and macro conditions.
Bear Case (~20 %)
Flat revenue and AI order delays, EPS ≈ $3.80, 12× multiple → fair value ≈ $46.
Reflects execution or macro slippage.
Weighted Fair Value: ≈ $58 per share (~8 % below current $74 price).
🔭 Forward Checkpoints to Monitor
Q2 AI-network bookings growth and conversion rate.
Recurring revenue as % of total (45 % target watch).
Cash-flow recovery trend and Splunk synergy delivery.
Competitive pricing in Ethernet and optics segments.
💡 Verdict
Cisco’s AI story is credible but largely priced in. At ~18× forward earnings, shares sit above their five-year average. Cash generation remains solid and the dividend safe, yet the margin of safety is thin after the rally.
Fair Price: ≈ $58 / share
Buy-Under Level: ≈ $55
Action: Hold for income; wait for a pullback before adding.
📣 Call to Action
Dividend investors should keep Cisco on their watchlist but avoid chasing momentum. Add on weakness below $55 to lock in a better yield and valuation margin.
⚖️ Disclaimer
This analysis is based solely on Cisco Systems’ official Q1 FY 2026 financial report and earnings call materials. It is for informational purposes only and not investment advice. Always verify figures with official sources and consider personal risk tolerance before investing.