TL;DR
AMD (AMD:NASDAQ) delivered a strong Q4 and full-year FY2025, with record revenue, accelerating data-center growth, and expanding margins. However, the stock sold off after earnings as investors recalibrated expectations around sequential growth, AI profitability, and Nvidia-relative positioning. At current levels, AMD looks roughly fairly valued, with upside hinging on faster-than-expected AI accelerator adoption.
Quarter Recap
Advanced Micro Devices closed FY2025 with momentum. Q4 revenue grew 34% year over year, driven primarily by data-center demand and continued EPYC share gains. AI accelerators contributed meaningfully, confirming AMD’s participation in the AI infrastructure build-out. That said, Q1 FY2026 guidance implied a sequential revenue decline, which became the focal point for post-earnings market reaction.
Key Highlights
- Q4 revenue of $10.27B, up 34% YoY, with Data Center revenue at $5.4B (+39% YoY)
- Full-year FY2025 revenue of $34.64B (+34% YoY)
- Non-GAAP gross margin expanded to 57% in Q4
- Q1 FY2026 revenue guidance of ~$9.8B ± $300M, implying a QoQ dip despite strong YoY growth
- Continued execution on the Instinct AI accelerator roadmap, alongside steady EPYC CPU share gains
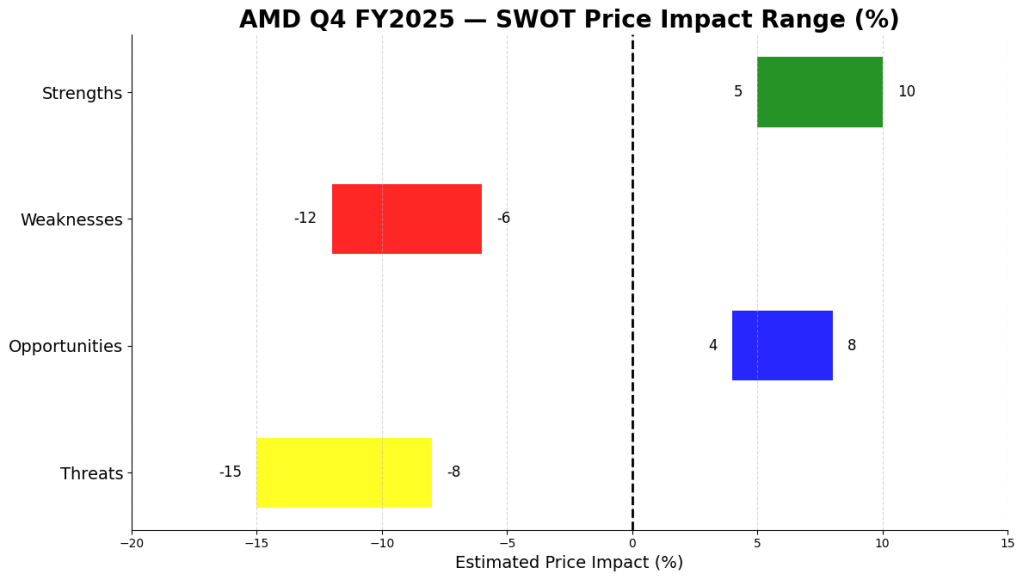
SWOT Analysis
AMD’s earnings confirmed strong execution, but also highlighted how elevated expectations now shape investor reactions. The stock is less sensitive to “beats” and more to the speed and profitability of AI scaling.
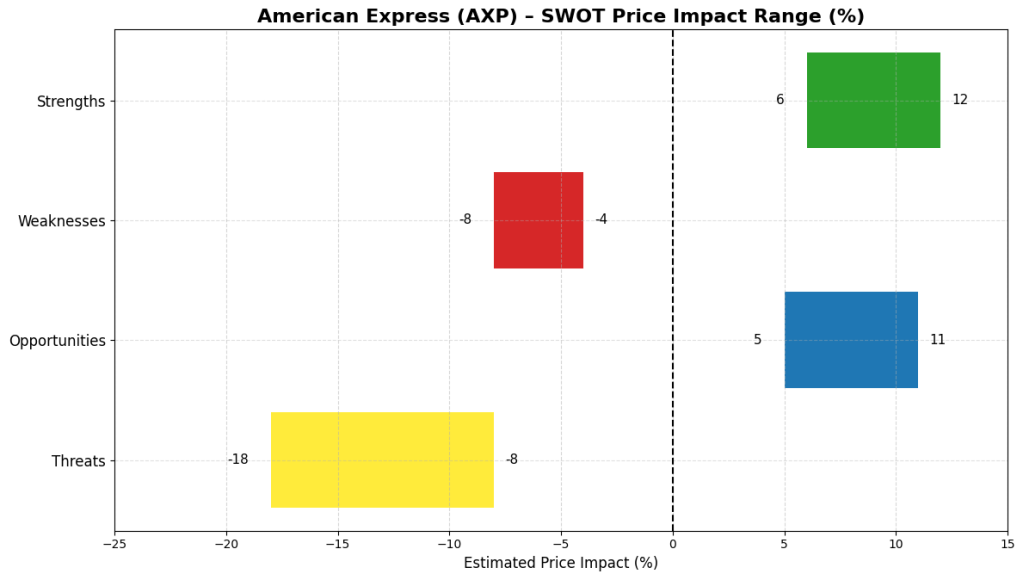
Strengths
- Data Center momentum is broad and durable (+5% to +10%)EPYC CPUs and Instinct accelerators both contributed, reinforcing AMD’s relevance across the data-center stack.
- Revenue scale and operating leverage improving (+4% to +8%)FY2025 marked a clear transition from cyclical recovery to scalable growth.
- Diversified end-market exposure (+2% to +5%)PCs, gaming, embedded, and data center reduce dependence on a single demand cycle.
Weaknesses
- AI margins trail Nvidia (-6% to -12%)AMD’s AI hardware is competitive, but software ecosystem and profitability still lag the market leader.
- Sequential guidance optics (-4% to -8%)A QoQ revenue decline contrasts with expectations for uninterrupted AI acceleration.
- China/export-control noise (-2% to -4%)MI308-related adjustments complicate margin transparency.
Opportunities
- Instinct accelerator roadmap execution (+8% to +15%)Successful scaling of MI300-series successors could materially shift AMD’s AI narrative.
- EPYC share gains vs. Intel (+5% to +10%)Incremental server CPU share gains have outsized financial impact.
- Customer diversification beyond Nvidia (+4% to +8%)Hyperscalers seeking second-source suppliers position AMD as the primary beneficiary.
Threats
- Nvidia’s ecosystem moat (-8% to -15%)CUDA and entrenched developer workflows remain a structural disadvantage.
- AI expectations already priced in (-5% to -10%)Execution may not be enough to prevent multiple compression.
- AI capex volatility (-4% to -7%)Any slowdown in hyperscaler spending would pressure AMD’s growth narrative.
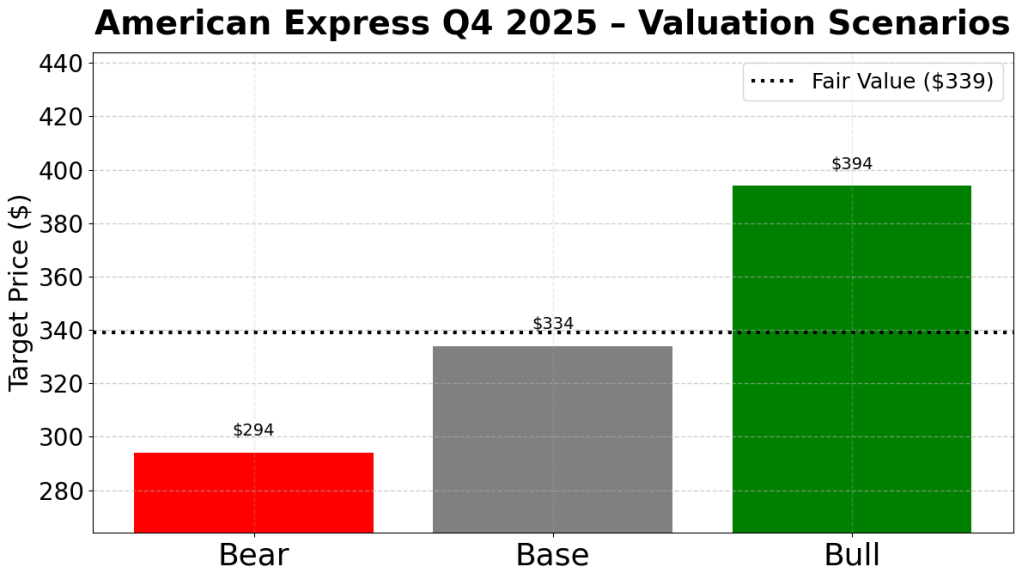
Valuation Scenarios
AMD’s valuation hinges on how quickly AI revenue scales and how much margin expansion follows.
Bear Case
- Slower AI adoption, modest margin gains
- Implied downside: -25% to -30%
Base Case
- Steady EPYC gains, gradual AI scaling
- Implied range: -5% to +10%
Bull Case
- Strong hyperscaler uptake of Instinct accelerators, accelerating margins
- Implied upside: +25% to +35%
Probability-weighted fair value: approximately $247, suggesting the stock is near fair value today.

Verdict
AMD remains a high-quality AI and data-center growth story, but the post-earnings sell-off shows the bar is rising. Near-term upside likely requires clear evidence of faster AI scaling and margin expansion, not just solid execution. Long-term investors may view pullbacks as opportunities, but expectations need to be reset.
Call to Action
If you found this analysis helpful, follow SWOTstock for more earnings breakdowns that cut through headlines and focus on what really drives valuation.
Disclaimer
This article is for informational and educational purposes only and does not constitute investment advice. Always conduct your own research or consult a financial professional before making investment decisions.