

TL;DR – BioNTech’s Story Is No Longer Just About COVID
BioNTech (NASDAQ: BNTX) newly announced global partnership with Bristol Myers Squibb marks a major milestone in its shift from pandemic-era vaccine leader to a diversified oncology innovator. The multi-billion-dollar agreement, centered around the bispecific antibody BNT327, gives BioNTech both near-term cash flow and long-term upside potential in solid tumor treatments. While risk remains around trial outcomes and execution, this partnership may help reset the company’s valuation narrative and attract long-term biotech investors looking beyond COVID normalization.
🧬Quarter Recap – Revenue Resilience and Oncology Focus Take Center Stage

BioNTech’s second quarter showcased steady financial execution, supported by ongoing COVID-19 vaccine revenue that continues to fund its aggressive R&D strategy. The company reported revenue of approximately $1.2 billion, reflecting sustained contributions from Comirnaty while vaccine demand tapers. However, the real story this quarter was not the top line—it was the strategic clarity around BioNTech’s future.
With research and development expenses rising 15% quarter-over-quarter, the company is clearly leaning into its oncology ambitions. Management emphasized its commitment to advancing next-generation immunotherapies, most notably BNT327, a bispecific antibody targeting PD-L1 and VEGF-A. The asset, acquired via the Biotheus transaction in 2024, is now in Phase 3 trials for multiple solid tumors including ES-SCLC and NSCLC. A Phase 3 study in triple-negative breast cancer is also expected by year-end, setting up key catalysts for 2026.
🌟 Key Developments – The Strategic Weight of the BMS Deal
The standout event this quarter was the announcement of a global partnership with Bristol Myers Squibb to co-develop and co-commercialize BNT327. The agreement provides BioNTech with a $1.5 billion upfront payment, additional guaranteed payments over the next several years, and significant potential milestone payouts. Importantly, the economics are structured as a 50:50 global profit-sharing arrangement, signaling Bristol’s confidence in the asset’s commercial viability.
For BioNTech, this collaboration serves multiple purposes. First, it de-risks the development of a key oncology pipeline candidate by sharing costs and leveraging BMS’s global reach and regulatory infrastructure. Second, it reinforces investor confidence that BioNTech’s pipeline can attract marquee partners—not just in mRNA but also in antibody-based modalities. Finally, it offers a non-dilutive capital infusion that enhances balance sheet flexibility without issuing equity or adding debt.
🧠 SWOT Analysis – Where BioNTech Stands After the BMS Deal

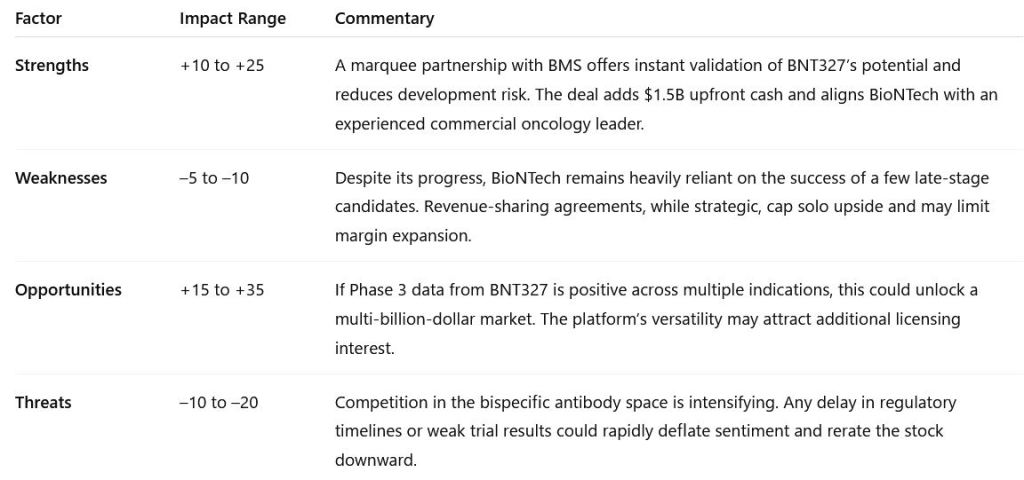
✅ Strengths (+10 to +25 USD/share impact)
BioNTech’s landmark partnership with Bristol Myers Squibb is a major credibility boost, both clinically and financially. The $1.5 billion upfront payment plus future milestone opportunities significantly de-risk the development of BNT327. More importantly, the 50:50 global profit-sharing structure means BioNTech now has a world-class commercial partner helping carry the execution load. For investors, this translates into greater confidence and visibility—potentially adding $10 to $25 per share in upside as development progresses and market confidence grows.
⚠️ Weaknesses (–5 to –10 USD/share impact)
Despite the strong partnership, BioNTech remains concentrated around a few key assets, particularly BNT327. This pipeline dependency raises risk if any major candidate stumbles. Additionally, while the profit-sharing model is strategic, it also caps BioNTech’s solo upside potential. The company also lacks a fully developed commercial infrastructure, especially in oncology, which could limit its leverage even with good data. These factors could weigh on valuation by $5 to $10 per share, especially in periods of uncertainty.
🚀 Opportunities (+15 to +35 USD/share impact)
If BNT327 delivers in Phase 3 trials, BioNTech could establish itself as a leader in solid tumor therapeutics. The indications in development—lung cancers and triple-negative breast cancer—represent multi-billion-dollar global markets. Strong data could not only drive rapid adoption but also open doors for more licensing deals or companion therapies. With expanding capabilities across mRNA, ADCs, and bispecifics, the company’s platform is increasingly credible. All told, this opportunity could lift the stock by $15 to $35 per share over the next 12–24 months.
🧨 Threats (–10 to –20 USD/share impact)
Competition in oncology is fierce. Several major pharma companies are investing heavily in bispecific antibodies and related immunotherapies. Clinical or regulatory setbacks—whether from safety signals, suboptimal efficacy, or trial delays—could hurt BioNTech’s momentum. Moreover, pricing pressure or shifting standards of care could impact long-term commercialization potential. If investor sentiment turns negative on the BNT327 story, it could drag the stock down by $10 to $20 per share in a bear-case scenario.
📊 Valuation Scenarios – A New Lens Post-Partnership
Under our updated outlook following the Bristol Myers Squibb partnership, BioNTech’s valuation potential can be framed across three core scenarios—bull, base, and bear—each reflecting different assumptions around BNT327’s success, pipeline execution, and competitive dynamics.

💰 What’s BioNTech Worth After the BMS Deal?
To value BioNTech post-Bristol Myers Squibb partnership, we consider three realistic outcomes for its oncology pipeline—each reflecting different degrees of clinical success and commercial impact.
🟢 Bull Case – $300/share (25% probability)
In the most optimistic scenario, BNT327 shows strong efficacy in late-stage trials and secures fast-track regulatory approval across multiple cancer types. Broad clinical adoption follows, boosting earnings to around $10 per share. Applying a 30x P/E ratio, the stock could be worth $300 per share. While aggressive, this scenario reflects the kind of breakout success biotech investors target—and we assign it a 25% probability.
⚪ Base Case – $180/share (60% probability)
The base case assumes steady but not spectacular execution. BNT327 gets approved and launches successfully, but uptake is gradual. Meanwhile, BioNTech’s other pipeline assets add modest support to revenue. Under this model, we forecast earnings of $7.50 and a valuation multiple of 24x, pointing to a target price of $180. Given current fundamentals and the BMS partnership, we assign this a 60% probability.
🔴 Bear Case – $100/share (15% probability)
In a downside scenario, BNT327 underwhelms in clinical trials or faces regulatory delays. Competitive pressure from other antibody platforms increases, and investor sentiment cools. If earnings slip to $5.00 and the stock trades down to a 20x multiple, we could see a revaluation to $100 per share. While less likely, we assign this outcome a 15% probability.

📊 Fair Value Estimate: $198
Weighted across all three scenarios, we estimate BioNTech’s fair value at $198 per share—well above its current trading level of ~$113 (as of June 2025). That implies ~75% upside if execution continues and trial results are even moderately positive.
📌 Probability-Weighted Fair Value:
(0.25×300)+(0.60×180)+(0.15×100)=198.00
Current Price (as of June 2, 2025): ~$113
Implied Upside: ~75%
✅ Verdict – This Is More Than a Deal; It’s a Strategic Signal
The Bristol Myers Squibb deal is more than just financial. It reflects institutional confidence in BioNTech’s shift toward long-term oncology growth. For investors, this partnership offers near-term visibility and long-term optionality. BNT327’s clinical readouts over the next 12–18 months will be pivotal, but the alignment with BMS significantly enhances BioNTech’s execution potential and credibility with both regulators and the market.
While the post-COVID revenue decline is no longer new news, BioNTech’s ability to refill its growth pipeline—and do so through strategic, non-dilutive partnerships—could make it one of the better-positioned mid-cap biotech stories heading into 2026.
📣 Call to Action
If you’re looking for exposure to immuno-oncology without the early-stage binary risk of preclinical names, BioNTech offers a compelling mid-cycle entry point. Follow trial updates closely, especially from the BNT327 Phase 3 programs, and watch for signs of further pipeline monetization or additional deals that validate the broader platform.
⚠️ Disclaimer
This analysis is based on publicly available company financials, earnings call commentary, and official press releases as of June 2025. It is intended for informational purposes only and does not constitute investment advice. Always perform your own due diligence.


Leave a comment