TL;DR Summary
Citigroup’s (NYSE: C) Q4 2025 results show real progress in core businesses like Services and Banking, but reported returns are still weighed down by restructuring costs and one-time items. The stock remains anchored to tangible book value, making this a classic execution-driven value story. Upside exists if management delivers on its 10–11% RoTCE target, but patience is required.
Quarter Recap
Citigroup reported Q4 2025 earnings that reflect a bank still in transition. Reported profitability declined year over year due largely to a Russia-related exit charge, but underlying operating trends were more constructive. Revenue held up across key businesses, investment banking activity rebounded sharply, and management emphasized that major geopolitical overhangs are now largely behind the company.
Key Highlights
- Net income of approximately $2.47 billion, impacted by a sizable one-time Russia exit loss
- Reported EPS of $1.19, with underlying performance stronger when adjusting for notable items
- Investment banking fees rose sharply year over year, signaling a recovery in deal activity
- Net interest income increased year over year, supported by higher average rates
- CET1 capital ratio of 13.2%, comfortably above regulatory requirements
- Tangible book value per share of $97.06 provides a clear valuation anchor
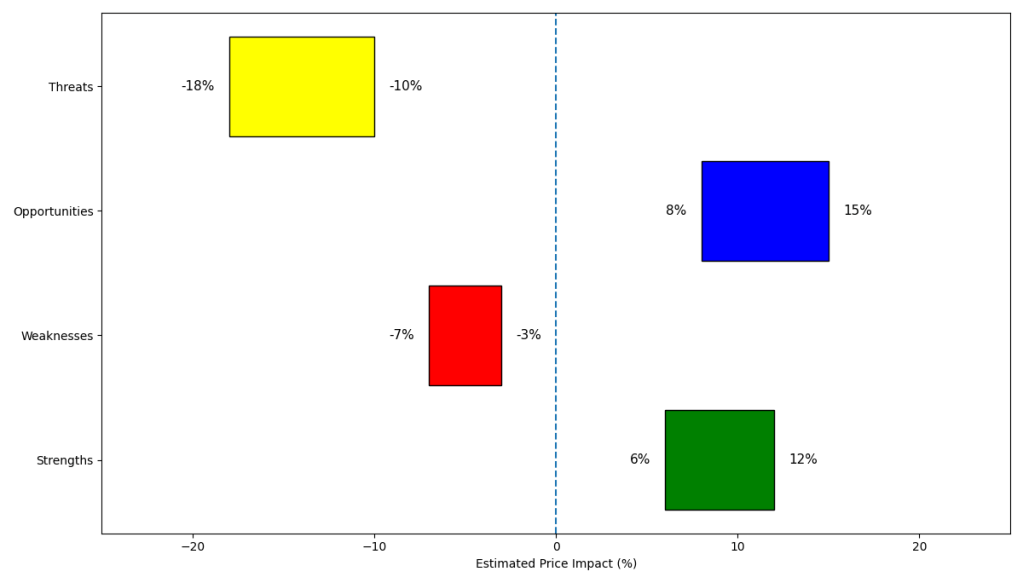
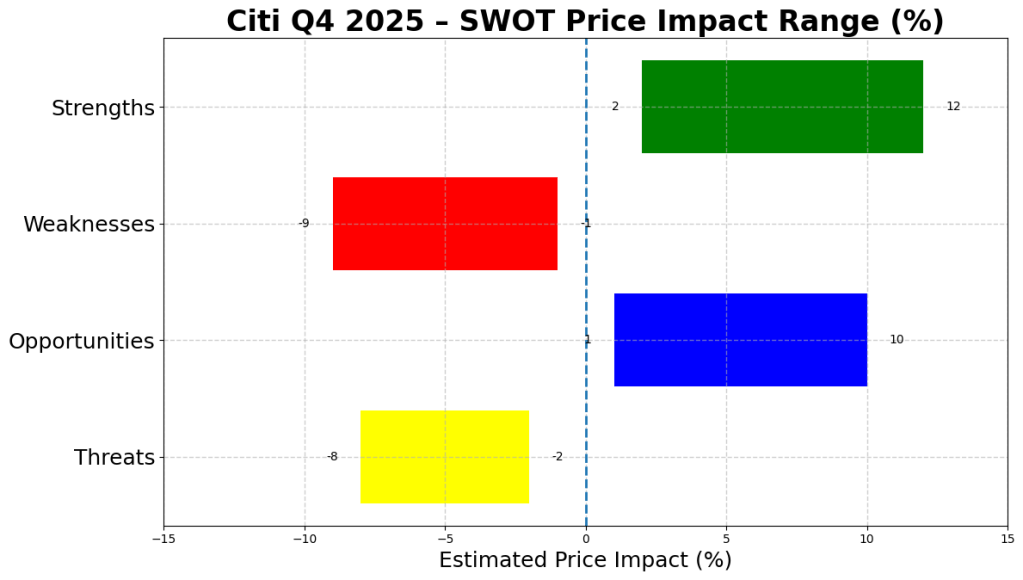
SWOT Analysis
Citigroup’s investment case remains centered on whether management can convert improving operating trends into sustainably higher returns on tangible equity. The quarter reinforced both the opportunity and the risks embedded in that thesis.
Strengths
- Services and institutional businesses continue to scale, improving the quality and durability of earnings (estimated price impact: +4% to +10%)
- Strong rebound in investment banking fees highlights Citi’s relevance in large, complex transactions (+3% to +8%)
- Capital strength and ongoing share buybacks provide downside support and optionality (+4% to +9%)
- Clear tangible book value base gives value investors a concrete reference point (+2% to +6%)
Weaknesses
- Reported RoTCE remains well below management’s 10–11% target, limiting valuation re-rating (−6% to −12%)
- Expense growth and a high efficiency ratio continue to pressure near-term profitability (−4% to −10%)
- Earnings remain vulnerable to one-time items during the restructuring phase (−2% to −6%)
Opportunities
- Achieving the stated RoTCE target could justify a meaningful re-rating toward tangible book value or above (+8% to +18%)
- Operating leverage from simplification and productivity initiatives could improve margins over time (+4% to +12%)
- Excess capital above regulatory requirements supports continued capital return (+3% to +9%)
Threats
- A turn in the credit cycle could quickly erode earnings and capital flexibility (−6% to −15%)
- Rate and macro sensitivity remain meaningful, particularly for net interest income (−3% to −10%)
- Execution risk persists if cost reductions fail to materialize as planned (−5% to −12%)
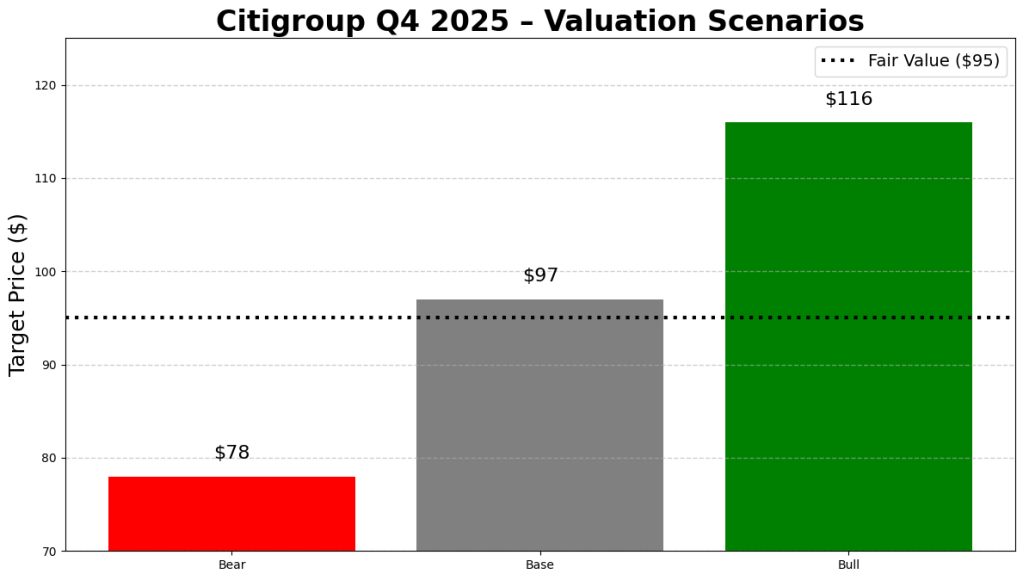
Valuation Scenarios
For Citi, valuation is best framed using price-to-tangible book value, as returns on tangible equity are the primary driver of long-term multiple expansion. With TBVPS at $97.06, the range of outcomes depends largely on execution.
Bear Case
- Assumes sub-par returns persist and credit or expense pressures rise
- Valuation at ~0.8× tangible book
- Implied value: ~$78
Base Case
- Assumes steady progress toward management’s RoTCE target without full re-rating
- Valuation at ~1.0× tangible book
- Implied value: ~$97
Bull Case
- Assumes credible delivery of 10–11% RoTCE with visible operating leverage
- Valuation at ~1.2× tangible book
- Implied value: ~$116
Probability-weighted fair value: approximately $95
Verdict
Citigroup remains a value investor’s execution bet. The stock is no longer distressed, but it is not yet priced for success. If management delivers on returns and expense discipline, today’s valuation leaves room for upside. If execution stalls, the stock risks remaining range-bound around tangible book value. For patient investors, Citi offers asymmetry — but not certainty.
Call to Action
If you’re tracking large U.S. banks from a value perspective, follow SWOTstock for earnings-driven breakdowns that focus on fundamentals, valuation discipline, and execution — not hype.
Disclaimer
This article is for informational purposes only and does not constitute investment advice. All analysis is based on publicly available company disclosures and reflects estimates and opinions at the time of writing. Investors should conduct their own research before making investment decisions.