Intuit Q2 FY2026: Why AI May Strengthen — Not Disrupt — the Tax Software Giant

Intuit’s stock surged 26% following solid earnings, contradicting fears that AI could disrupt tax preparation software. The company’s regulatory compliance, legal liabilities, and extensive financial data form strong barriers to entry. Results indicate resilience against AI threats, signaling investor reassessment of Intuit’s value amidst broader market challenges.

TL;DR

AI fears triggered a massive selloff in software stocks over the past few weeks, and Intuit (INTU:NASDAQ) was caught in the narrative that generative AI could replace tax preparation and accounting software.

But Intuit’s latest earnings suggest the opposite may be happening.

From the day before earnings to March 6, Intuit’s stock surged about 26%, dramatically outperforming both the software sector ETF IGV (~+9%) and the S&P 500 (~-3%) over the same period.

The divergence suggests investors may be reassessing the AI disruption thesis.

Tax preparation is not just software. It involves regulatory compliance, legal liability, and long-term financial data trust — structural advantages that favor incumbents like Intuit.


Quarter Recap

Intuit’s latest quarterly results demonstrated continued strong momentum across its core businesses.

Key highlights:

  • Revenue grew 17% year-over-year
  • Non-GAAP EPS increased 25%
  • Small business and consumer segments both delivered solid growth
  • Full-year guidance remained intact

Despite widespread fears that AI could undermine the company’s value proposition, the earnings report showed no signs of structural weakness in demand.

Instead, the results reinforced that Intuit’s ecosystem continues expanding across tax preparation, accounting, payroll, and financial management services.


Market Reaction

The most telling signal came from the market’s reaction.

From February 25 to March 6:

  • Intuit (INTU): +26%
  • Software ETF (IGV): +9%
  • S&P 500: -3%

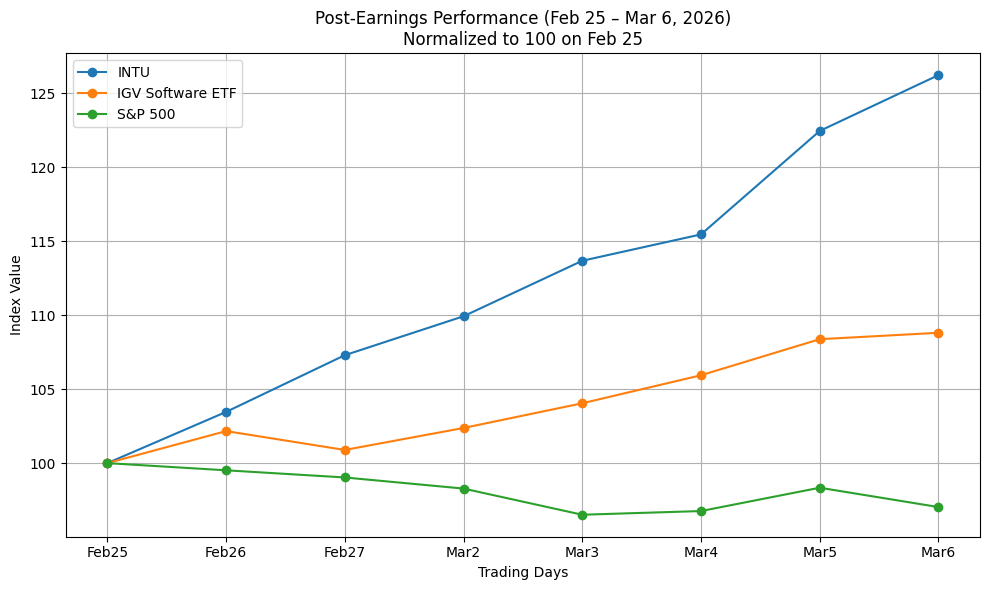
This divergence indicates the rally was company-specific, not simply a sector move.

While broader markets struggled with geopolitical tensions and macro volatility, investors appeared to reprice Intuit upward after reassessing the AI threat narrative.


Key Highlights

Three structural factors help explain why AI disruption may be harder than many investors initially assumed.

1. Tax preparation involves legal liability

Tax returns are not just informational outputs.

They represent legally filed financial documents.

Companies like Intuit effectively stand behind the accuracy of their systems. If errors occur, audits and penalties can follow.

An AI chatbot providing general advice does not carry the same legal responsibility.


2. Regulatory infrastructure creates barriers

Tax software integrates directly with government filing systems, financial institutions, and accounting workflows.

This infrastructure took decades to build and maintain.

AI models alone cannot easily replicate these regulatory integrations.


3. Financial data trust forms a powerful moat

Millions of individuals and businesses store years of financial history inside the Intuit ecosystem.

That historical data matters for:

  • tax carry-forwards
  • financial planning
  • bookkeeping continuity
  • compliance records

Switching platforms introduces risk and friction, strengthening customer retention.
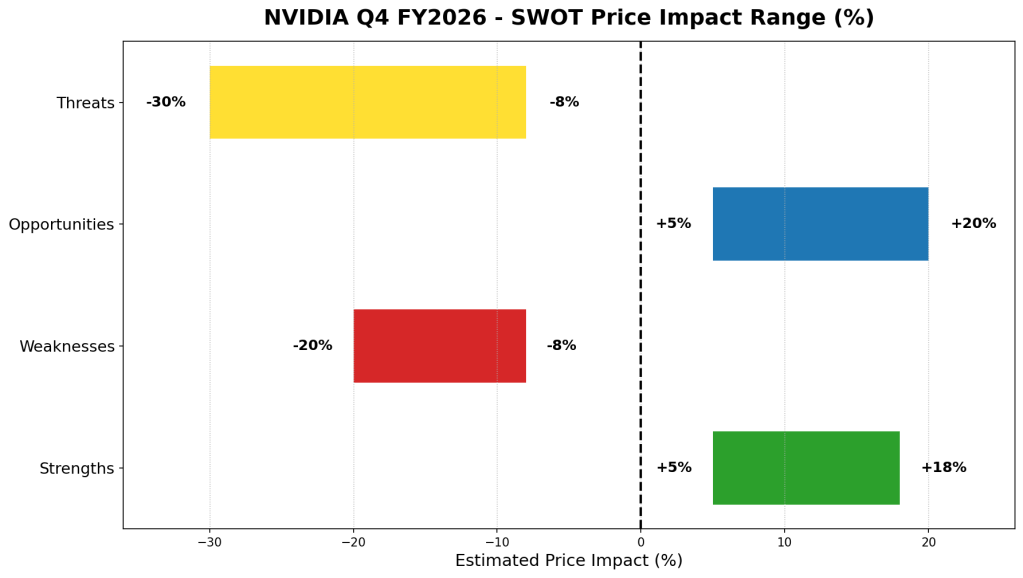

SWOT Analysis

Strengths

Intuit’s moat rests on regulatory integration, trusted infrastructure, and proprietary financial data.

These advantages make the company far more resilient to AI disruption than typical SaaS providers.

In fact, AI may enhance the platform by enabling new capabilities such as automated bookkeeping, predictive financial insights, and tax optimization.

Estimated price impact: +$40 to +$80


Weaknesses

Despite the recent rally, Intuit still faces high expectations for continued growth.

If growth slows significantly or AI commoditizes certain services, the market could compress valuation multiples.

Estimated price impact: −$20 to −$40


Opportunities

AI could expand Intuit’s platform into a broader financial operating system for individuals and small businesses.

Potential capabilities include:

  • automated financial forecasting
  • real-time tax planning
  • intelligent expense classification
  • AI-assisted audit preparation

These features could increase platform engagement and raise switching costs.

Estimated price impact: +$60 to +$120


Threats

Some adjacent product areas — particularly marketing automation and other software services — face more traditional competitive pressures.

Additionally, government initiatives around simplified tax filing could create long-term competitive risks.

Estimated price impact: −$40 to −$80
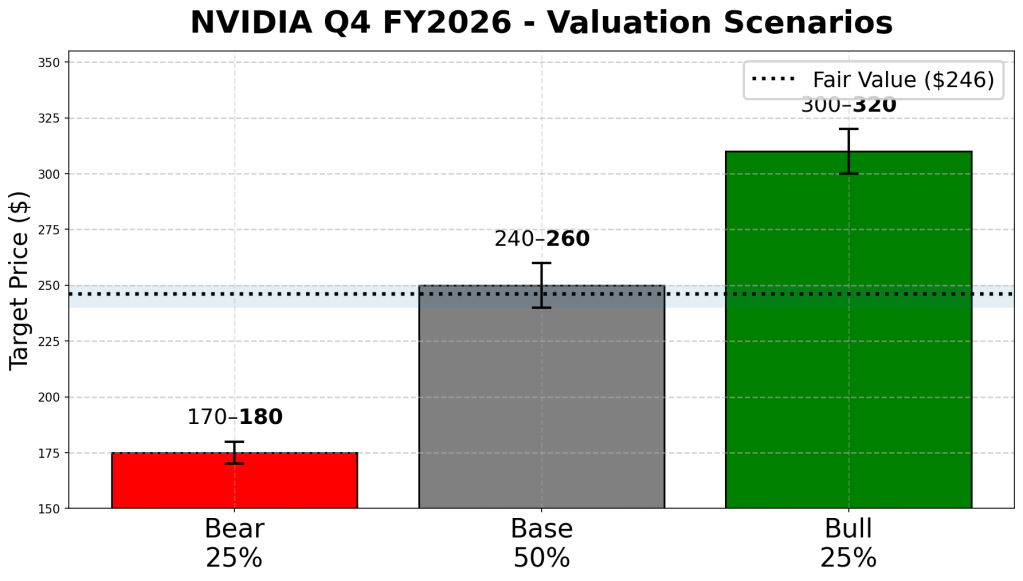

Valuation Scenarios

Bear Case — AI commoditizes some services

If growth slows to high-single digits and valuation multiples compress:

Estimated fair value: $350–380

Probability: 25%


Base Case — AI enhances the platform

If Intuit maintains mid-teens growth and expands its ecosystem:

Estimated fair value: $430–480

Probability: 50%


Bull Case — AI expands the TAM

If AI significantly increases platform engagement and revenue opportunities:

Estimated fair value: $550–650

Probability: 25%


Probability-Weighted Fair Value

Combining the three scenarios yields an estimated fair value around:

~$470 per share


Verdict

The recent earnings report does not support the idea that AI will disrupt Intuit’s core business.

Instead, the evidence suggests something more nuanced.

In industries where software intersects with legal responsibility, regulatory integration, and trusted financial data, AI may actually reinforce incumbents rather than displace them.

Intuit appears to be one of those cases.

The stock’s strong post-earnings rally suggests investors are beginning to recognize this dynamic.


Call to Action

If you enjoy this type of analysis, follow SWOTstock for more deep dives into how structural industry forces shape long-term stock performance.


Disclaimer

This article is for informational purposes only and does not constitute investment advice. Investors should conduct their own research and consider their risk tolerance before making investment decisions.


NVIDIA Q4 FY2026 Earnings: AI Dominance Intact — Is the Stock Still Underpricing the Cycle?

TL;DR Summary

NVIDIA (NVDA:NASDAQ) delivered another explosive quarter, with Q4 revenue up 73% year-over-year and Data Center revenue surging 75%. Gross margins remain near 75%, and management guided to $78B in next-quarter revenue — even excluding China data center compute revenue.

The AI infrastructure cycle is clearly not over.

Based on official financials and management guidance, fair value lands around $240–$250, versus the current price near $150. For growth investors, the debate is no longer whether NVIDIA is dominant — it’s whether the AI cycle can extend long enough to justify sustained premium valuation.


Quarter Recap

NVIDIA reported Q4 FY2026 revenue of $68.1B, up 73% year-over-year and 20% sequentially. The real engine remains Data Center, which generated $62.3B, growing 75% YoY.

Gross margins held near 75%, confirming that pricing power remains intact despite scale. Full-year FY2026 revenue reached $215.9B, up 65% from the prior year.

Management guided Q1 FY2027 revenue to $78B ±2%, notably excluding China data center compute revenue. That implies the core AI demand machine remains strong even under export constraints.


Key Highlights

• Data Center revenue continues to scale at hyperscale velocity

• Blackwell ramp is underway, supporting next-gen demand

• Gross margin durability near 75% signals structural advantage

• China revenue excluded from guidance, reducing forward visibility but also lowering expectation risk

• $41.1B returned to shareholders in FY2026 through buybacks and dividends


SWOT Analysis

NVIDIA is no longer being valued as a chipmaker. It is being valued as the foundational AI infrastructure layer. The sustainability of that thesis depends on ecosystem dominance, demand durability, and competitive containment.

Strengths

• AI infrastructure leadership with 75% YoY Data Center growth

Estimated price impact: +10% to +18%

• CUDA + NVLink ecosystem lock-in creating high switching costs

Estimated price impact: +8% to +15%

• Sustained gross margin near 75% demonstrating pricing power

Estimated price impact: +5% to +10%

• Visible product roadmap (Blackwell, Rubin) reducing cycle uncertainty

Estimated price impact: +6% to +12%


Weaknesses

• Heavy revenue concentration in Data Center

Estimated price impact: -8% to -15%

• Premium valuation near ~45x earnings requires near-flawless execution

Estimated price impact: -10% to -20%


Opportunities

• Inference demand expansion beyond training workloads

Estimated price impact: +10% to +20%

• Sovereign AI and enterprise adoption wave

Estimated price impact: +8% to +15%

• Software monetization and services layer expansion

Estimated price impact: +5% to +12%


Threats

• China export restrictions tightening further

Estimated price impact: -8% to -18%

• Hyperscaler custom silicon (ASICs) long-term margin risk

Estimated price impact: -10% to -20%

• AI capex digestion cycle if hyperscalers pause

Estimated price impact: -15% to -30%

NVIDIA Q4 FY2026 SWOT price impact range chart showing Strengths (+5% to +18%), Weaknesses (-20% to -8%), Opportunities (+5% to +20%), and Threats (-30% to -8%) with a zero reference line.
NVIDIA Q4 FY2026 SWOT price impact analysis. Strengths and Opportunities suggest upside potential of up to +20%, while Weaknesses and Threats indicate downside risk reaching -30%, highlighting both AI leadership momentum and valuation sensitivity.

Valuation Scenarios

Bear Case — AI Growth Moderates

Assumptions:

• EPS slows to ~$6.00

• Multiple compresses to ~30x

Target price: $170–$180

Probability: 25%


Base Case — Strong but Moderating Growth

Assumptions:

• EPS ~$6.50

• Multiple stabilizes ~40x

Target price: $240–$260

Probability: 50%


Bull Case — AI Cycle Extends Multi-Year

Assumptions:

• EPS ~$7.00+

• Multiple holds 45–50x

Target price: $300–$320

Probability: 25%


Probability-Weighted Fair Value

Weighted fair value: ~$246

Fair value range based strictly on official financials:

$240–$250

NVIDIA Q4 FY2026 valuation scenarios chart showing Bear case $170–$180 (25%), Base case $240–$260 (50%), and Bull case $300–$320 (25%) with a probability-weighted fair value of $246.
NVIDIA Q4 FY2026 valuation scenarios. The Base case ($240–$260) carries the highest probability at 50%, while the Bull case extends toward $320 if the AI cycle persists. The probability-weighted fair value stands near $246, with a $240–$250 range based strictly on official financials.

Verdict

For Type 1 growth investors, NVIDIA remains the clearest AI infrastructure winner. The numbers show no structural slowdown yet. Gross margins remain elite. Guidance implies continued scale.

The real risk is not weak demand — it’s cycle compression. If AI capex pauses, the stock will re-rate quickly. But as long as hyperscaler demand persists, NVIDIA remains structurally advantaged.

This is no longer an early-stage AI bet. It is an AI cycle duration bet.


Call to Action

If you follow AI infrastructure leaders, subscribe to SWOTstock for structured earnings breakdowns, price-impact SWOT analysis, and scenario-based valuation models built for growth investors.


Disclaimer

This analysis is for informational purposes only and does not constitute investment advice. Always conduct your own due diligence and consult a licensed financial advisor before making investment decisions.


Berkshire Hathaway FY2025: Still a Compounding Machine — But Is There Enough Margin of Safety?

Berkshire Hathaway’s FY2025 results showed a slight decline in operating earnings and increased insurance volatility, yet the company holds a record cash position of over $370B. With disciplined capital allocation under CEO Greg Abel, the stock trades near its intrinsic value at around $500 per share, offering limited margin of safety for value investors.

TL;DR Summary

Berkshire Hathaway’s FY2025 results showed softer operating earnings and insurance volatility, yet the balance sheet has never been stronger. With over $370B in cash and disciplined capital allocation under Greg Abel, the long-term compounding story remains intact. However, at around $500 per BRK.B share, the stock appears close to fair value. For DIY value investors, the key question is no longer quality — it’s margin of safety.


Quarter Recap

Berkshire Hathaway reported FY2025 results in late February 2026. Operating earnings declined modestly year-over-year, reflecting weaker insurance underwriting and investment writedowns. GAAP net income was more volatile due to mark-to-market adjustments in the equity portfolio.

Despite softer earnings, Berkshire ended the year with a record cash position exceeding $370B. Share repurchases remained limited, and the company was a net seller of equities during much of the year.

This was also the first full annual report under CEO Greg Abel, marking a formal transition from the Buffett era while maintaining the same capital allocation philosophy.


Key Highlights

• Operating earnings declined modestly year-over-year

• Insurance underwriting results weakened in Q4

• Cash & equivalents reached record levels (~$370B+)

• No major acquisition deployed despite large liquidity

• Leadership transition to Greg Abel formally underway

• Equity portfolio remains concentrated in high-quality holdings


SWOT Analysis

Berkshire is not an earnings-momentum stock. It is a capital allocator built for long-term compounding. FY2025 did not break the story — but it did test investor patience. For value investors, durability matters more than quarterly growth.


Strengths

• Massive cash position providing downside protection and acquisition optionality

Estimated Price Impact: +5% to +12%

• Diversified operating businesses (insurance, rail, energy, manufacturing)

Estimated Price Impact: +4% to +8%

• Long-standing capital allocation discipline now reinforced under Abel

Estimated Price Impact: +3% to +7%

• High-quality equity portfolio generating dividends and embedded gains

Estimated Price Impact: +4% to +10%


Weaknesses

• Insurance earnings volatility and catastrophe exposure

Estimated Price Impact: -3% to -8%

• Slower organic growth relative to high-growth market leaders

Estimated Price Impact: -2% to -6%

• Leadership transition uncertainty in post-Buffett era

Estimated Price Impact: -3% to -7%


Opportunities

• Large-scale acquisition during market downturn

Estimated Price Impact: +8% to +15%

• Improvement in insurance pricing cycle

Estimated Price Impact: +4% to +9%

• Opportunistic share buybacks below intrinsic value

Estimated Price Impact: +5% to +10%


Threats

• Major insurance catastrophe event

Estimated Price Impact: -6% to -15%

• Significant equity portfolio drawdown

Estimated Price Impact: -5% to -12%

• Prolonged inability to deploy excess cash effectively

Estimated Price Impact: -3% to -8%

Horizontal SWOT price impact bar chart for Berkshire Hathaway FY2025 showing full percentage ranges: Strengths (+5% to +12%), Opportunities (+4% to +15%), Weaknesses (-8% to -2%), and Threats (-15% to -3%), with a vertical dashed zero line.
Berkshire Hathaway FY2025 SWOT price impact ranges highlight asymmetric downside risk from insurance volatility (-15%) versus upside potential from capital deployment and earnings normalization (+15%).

Valuation Scenarios (based on BRK.B)

Berkshire should be valued on normalized operating earnings rather than GAAP net income due to mark-to-market volatility. Using conservative assumptions aligned with Buffett-style valuation discipline:


Bear Case

Flat or declining operating earnings

14× earnings multiple

No major capital deployment

Implied Price Target: $430

Probability: 30%


Base Case

4–6% operating earnings growth

16× earnings multiple

Gradual capital deployment

Implied Price Target: $505

Probability: 50%


Bull Case

8–10% earnings growth

Successful large acquisition

18× earnings multiple

Implied Price Target: $580

Probability: 20%


Probability-Weighted Fair Value:

≈ $498

Vertical valuation scenarios bar chart for Berkshire Hathaway FY2025 showing Bear case at $430 (red), Base case at $505 (gray), and Bull case at $580 (green), with a dotted fair value line at $498.
Berkshire Hathaway FY2025 valuation scenarios range from $430 in a bear case to $580 in a bull case, with a probability-weighted fair value estimate of approximately $498 per share.

Verdict

Berkshire Hathaway remains one of the highest-quality capital allocators in the world. The balance sheet strength is extraordinary, and the business model remains durable.

However, at roughly $500 per BRK.B share, the stock trades close to intrinsic value under conservative assumptions. There is limited margin of safety unless earnings growth accelerates or a large acquisition creates incremental intrinsic value.

For DIY value investors, Berkshire is still a core compounding vehicle — but not a deep bargain today.


Call to Action

If you are building a long-term value portfolio, ask yourself:

Are you buying Berkshire for safety, or for upside?

Follow SWOTstock for structured, investor-focused earnings analysis grounded in intrinsic value logic — not headlines.


Disclaimer

This article is for informational purposes only and does not constitute investment advice. Investors should conduct their own research and consider their financial circumstances before making investment decisions.