

TL;DR Summary
Morgan Stanley delivered a strong Q2 2025, with $16.8 B revenue and EPS of $2.13, both above expectations. Wealth Management inflows of $59 B and robust trading performance offset a 5% decline in investment banking fees. The firm also raised its dividend to $1.00/share (yielding ~2.8%) and approved a $20 B share buyback, underscoring its commitment to returning capital. Despite these positives, shares slipped ~1–2% post‑earnings, reflecting cautious sentiment around capital markets headwinds. Our fair value estimate remains ~$144, near current levels, with upside tied to a revival in dealmaking and continued strength in Wealth Management.
Quarter Recap
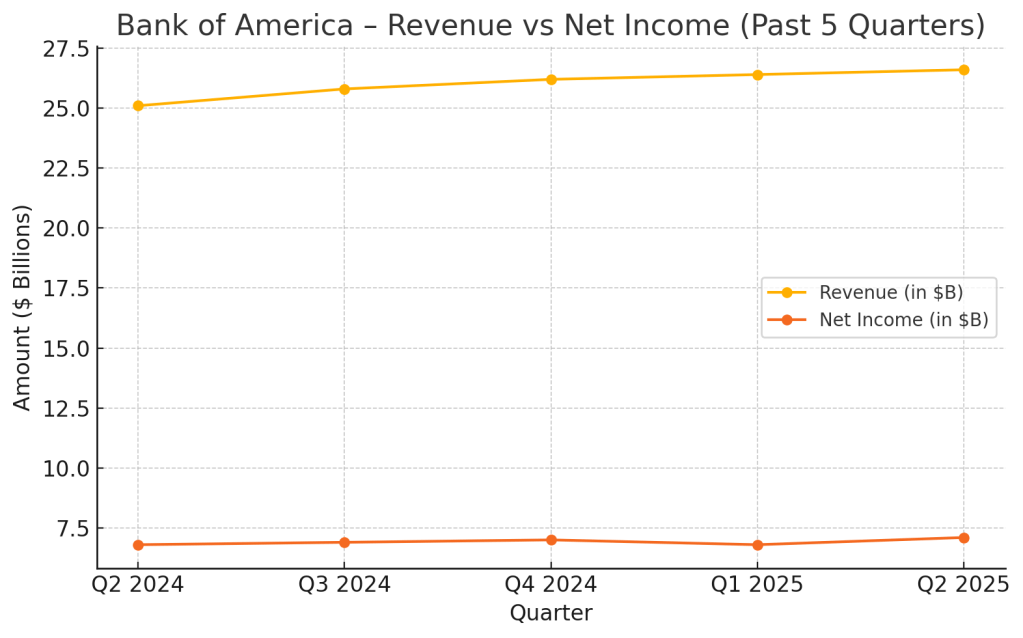
Morgan Stanley reported net revenues of $16.8 B, up 12% YoY, and EPS of $2.13, beating consensus by 7.6%. ROTCE reached 18.2%, reaffirming the firm’s profitability strength.
Wealth Management added $59 B in net new assets, partially offset by $22 B in tax-related outflows. Trading was a bright spot: equities revenue came in at ~$3.7 B (+23% YoY) and fixed income at ~$2.2 B (+9%). These gains helped offset investment banking fees, which fell ~5% YoY and remain below pre‑2022 levels.
Capital returns were a highlight: the board approved a quarterly dividend increase to $1.00/share (yielding ~2.8% at current prices) and a $20 B share repurchase program, beginning in Q3 2025.
Key Highlights
- Revenue: $16.8 B (+12% YoY)
- EPS: $2.13 (+7.6% above consensus)
- ROTCE: 18.2%
- Wealth Management: $59 B net new assets, offset by $22 B in tax outflows
- Trading: Equities $3.7 B (+23%); Fixed income $2.2 B (+9%)
- Investment Banking: Down ~5% YoY; still lagging pre‑2022 levels
- Capital Returns: Dividend raised to $1.00/share (~2.8% yield); $20 B buyback approved

Peer Comparison
Morgan Stanley’s steady, wealth-led approach continues to differentiate it. But when comparing to peers, Goldman Sachs grew investment banking revenue ~26% YoY, while Morgan Stanley saw a 5% decline. JPMorgan also outpaced MS in advisory and underwriting activity. This highlights a strategic trade‑off: Morgan Stanley prioritizes stable Wealth Management growth, sacrificing some upside in deal-driven businesses.

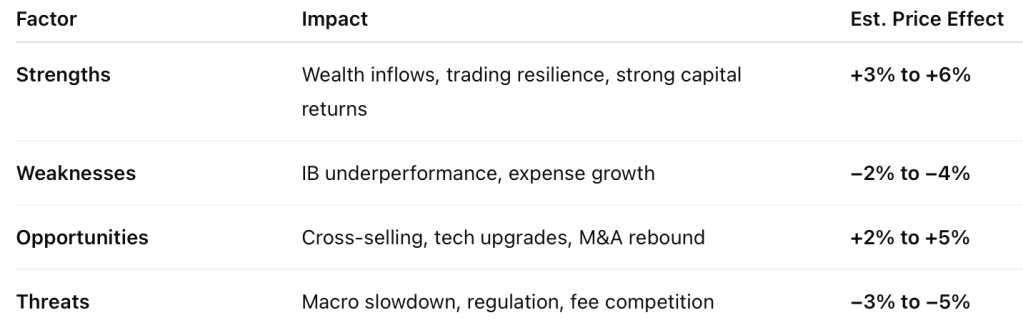
SWOT Analysis
Morgan Stanley’s Q2 shows why the market reacted cautiously: the firm delivered solid results, but investors remain concerned about weaker capital markets revenue and near-term growth visibility.
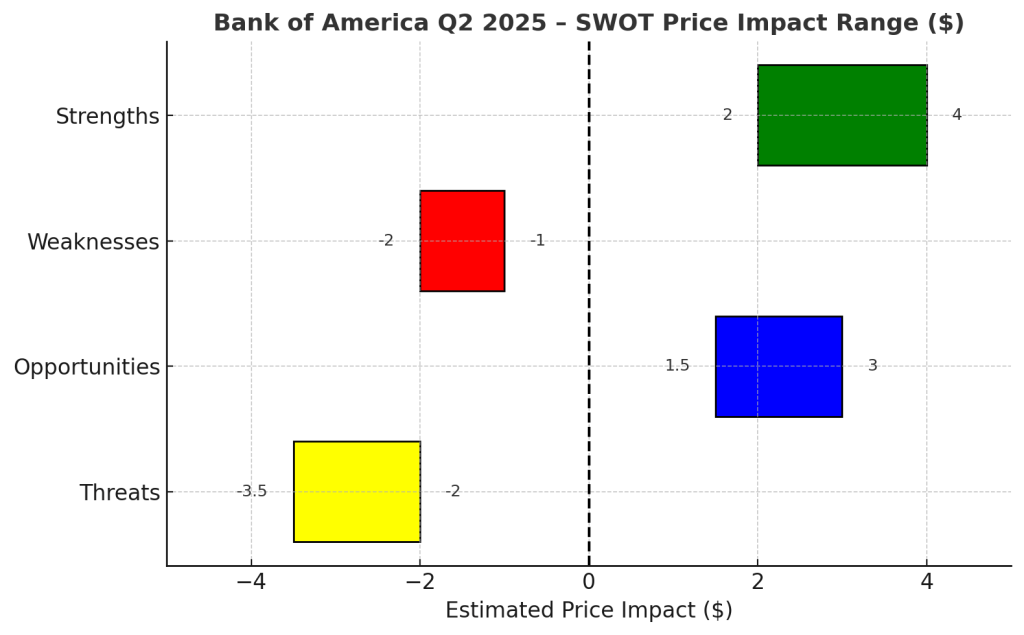
Strengths (+$4 to +$8):
- Wealth inflows: $59 B new assets despite tax-related outflows
- Trading strength: Equities +23%, Fixed Income +9% YoY
- Capital returns: Dividend raised to $1/share (~2.8% yield) and $20 B buyback
- Strong profitability: ROTCE at 18.2%, EPS beat of 7.6%
Weaknesses (−$3 to −$6):
- Investment banking lag: −5% YoY vs Goldman’s +26%
- Expense growth: Costs rising faster than some revenue lines
- Client outflows: Tax outflows muted net inflow impact
Opportunities (+$3 to +$7):
- Cross-selling E*TRADE clients within Wealth Management
- Tech and AI investments to enhance operating leverage
- Rebound in IPO/M&A could significantly lift investment banking revenues
Threats (−$4 to −$7):
- Macro risks: Slowing economy could cut dealmaking & trading volumes
- Regulatory pressures: Higher capital requirements could restrict buybacks
- Competitive fee pressure: Margin erosion in Wealth Management & brokerage
Net SWOT price impact: −$7 to +$8 (implying short-term trading range between ~$136 and $151).
SWOT Table

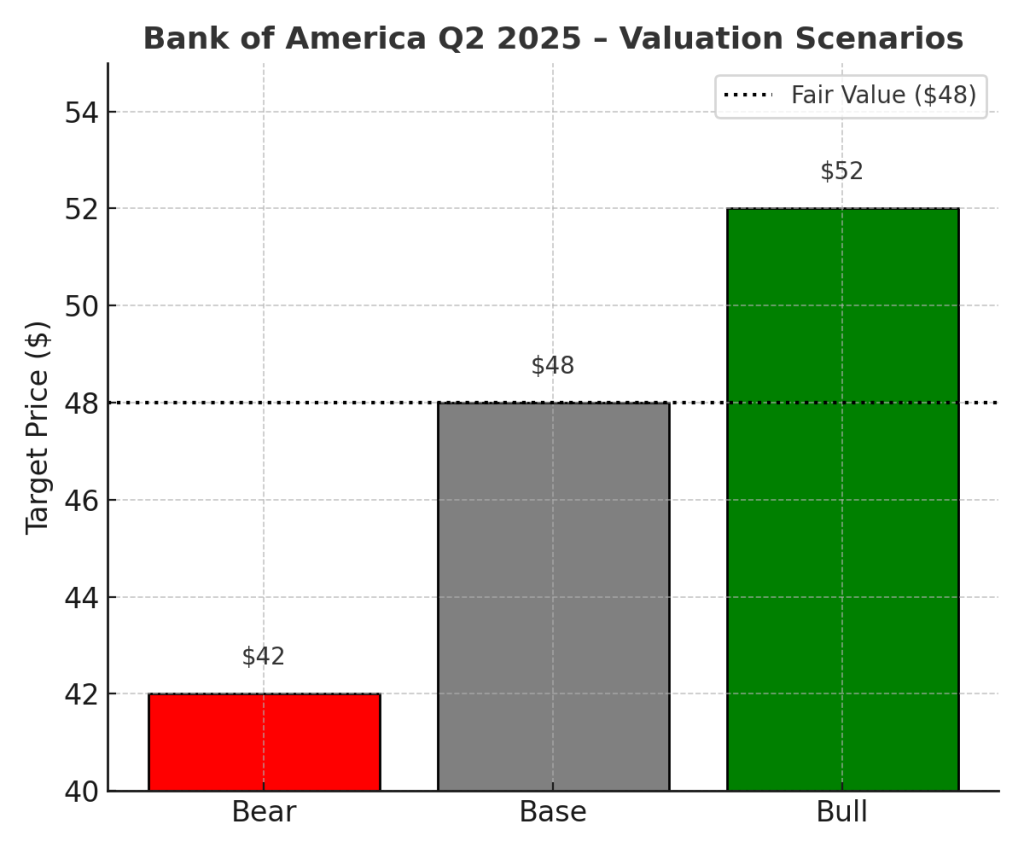
Valuation Scenarios
Current price: ~$143.56
- Bull Case (30%):
IB revenue rebounds +5%, WM inflows >$50 B/quarter, ROTCE >18%.
Target: $162 - Base Case (50%):
Stable WM inflows, trading moderates, IB remains sluggish.
Target: $144 - Bear Case (20%):
WM growth slows, trading revenue drops, regulatory capital costs rise.
Target: $121
Probability‑weighted fair value:(0.3 × 162) + (0.5 × 144) + (0.2 × 121) = **$144.3**
Fair value: ~$144
Assessment: Fairly valued. Any upside depends on an M&A/IPO rebound and sustained asset growth in Wealth Management.

12‑Month Outlook
Looking ahead, Morgan Stanley’s fortunes will hinge on:
- Capital markets recovery: IPO/M&A activity improving in 2026 could reaccelerate IB revenue.
- Sustained Wealth inflows: Maintaining $50 B+/quarter will support fee growth and capital returns.
- Regulatory clarity: New capital requirements could affect buyback pace.
Verdict
Morgan Stanley remains a defensive, shareholder-friendly play, with stable wealth-led earnings and enhanced capital returns. While near-term upside is capped by muted deal activity, long-term investors benefit from solid dividends, repurchases, and consistent profitability.
Call to Action
Are you bullish on Morgan Stanley’s wealth-first strategy? Drop your thoughts below, and subscribe for more SWOT-driven earnings breakdowns to help you invest smarter.
Disclaimer
This analysis is based solely on Morgan Stanley’s official Q2 2025 financial report and earnings call transcript. It is for informational purposes only and is not investment advice.


Leave a comment