Bank of America Q3 2025 — “Steady Hands in a Choppy Cycle”

Bank of America demonstrated strong Q3 2025 results with an EPS of $1.06 and a net interest income of $15.2 billion, alongside a 43% rise in investment-banking fees. Management’s increased Q4 guidance reflects confidence. The bank’s stability positions it as a reliable choice for value investors amid economic uncertainty.

TL;DR

Bank of America reported a steady and resilient Q3 2025: EPS came in at $1.06, net interest income rose to $15.2 billion, and investment-banking fees jumped 43%. Management also raised Q4 NII guidance, signaling confidence heading into year-end. After the release, the stock traded roughly 2–3% higher, reflecting a market that values stability in a choppy macro environment. For DIY value investors, this quarter underscores BofA’s role as a dividend-reliable, moderately undervalued financial anchor rather than a high-beta trade.


Quarter Recap

Bank of America delivered a steady and confident performance in Q3 2025, leaning more on disciplined execution than dramatic surprises. Net income reached $8.5 billion, translating to $1.06 per share, comfortably above expectations and supported by $15.2 billion in net interest income that remained resilient despite shifting rate dynamics. Management emphasized that positive operating leverage reflected tighter cost control and continued investment in risk management and technology. Capital markets activity added a welcome boost, with investment-banking fees rising 43% as dealmaking and underwriting improved from last year’s lows. Importantly for long-term investors, the bank’s CET1 ratio stayed above 12%, reinforcing its capacity to maintain dividends and pursue selective buybacks even in a more uncertain macro backdrop. Overall, the quarter underscored BofA’s ability to produce stable, repeatable earnings at a time when many peers are navigating more uneven conditions.


Key Highlights

  • EPS: $1.06, above internal targets and analyst expectations.
  • Net Interest Income: $15.2B, maintaining upward momentum.
  • Investment-Banking Fees: +43% YoY, continued rebound in capital markets.
  • Operating Leverage: Positive, reflecting disciplined expense control.
  • Credit Costs: Stable, no significant deterioration in consumer or commercial books.
  • Capital Position: CET1 above 12%, supporting sustained shareholder returns.
  • Guidance: Q4 NII raised to $15.6–15.7B, signaling management confidence.
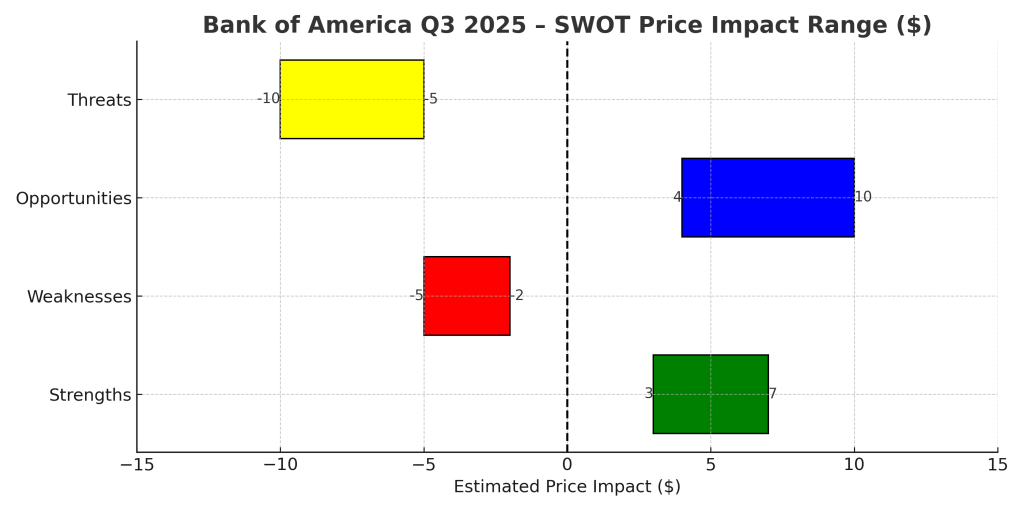
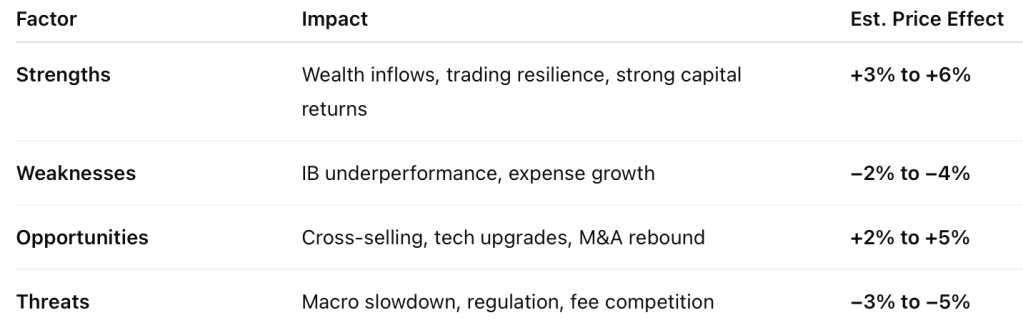
SWOT Analysis

Strengths (+3% → +7%)

• Strong NII performance and EPS beat

• Well-managed expenses and positive operating leverage

• Dividend raised earlier this year, supported by capital strength

Weaknesses (–5% → –2%)

• Slower loan growth compared to peers

• Slight margin compression in wealth management

• Tech and compliance investments increasing non-interest expense

Opportunities (+4% → +10%)

• Investment-banking recovery (+43% YoY)

• Stable credit trends with room for normalization upside

• Rate-cycle normalization in 2026 may boost loan demand

Threats (–10% → –5%)

• CRE and credit-card segments remain watch-list risks

• Potential capital-rule tightening limiting buybacks

• Prolonged macro uncertainty affecting NII trajectory

Horizontal bar chart showing Bank of America Q3 2025 SWOT price impact ranges. Strengths (+3 to +7 %), Weaknesses (–5 to –2 %), Opportunities (+4 to +10 %), and Threats (–10 to –5 %). The chart uses green for strengths, red for weaknesses, blue for opportunities, and yellow for threats, with a dashed vertical line at zero indicating neutral impact.

Valuation Scenarios (12-Month Outlook)

Using official Q3 performance, NII guidance, and credit commentary:

Bull Case – $56 (+15%)

• Sustained NII strength

• Continued recovery in investment banking

• Flat credit losses into 2026

Base Case – $51.3 (+5%)

• Stable NII

• Moderate fee growth

• Expense discipline maintained

Bear Case – $44 (–10%)

• Margin compression from declining rates

• Credit costs rise toward the historical mean

• CRE pockets worsen

Probability-Weighted Fair Value:

(0.3 x 56) + (0.5 x 51.3) + (0.2 x 44) = approx. $51.1

Vertical bar chart illustrating Bank of America Q3 2025 valuation scenarios. Bear case $44 (20 %), Base case $51.3 (50 %), and Bull case $56 (30 %). A dashed horizontal line marks the calculated fair value at about $51 per share. Bars are color-coded red, gray, and green respectively.

Verdict

Bank of America continues to deliver what value-focused investors want: predictable earnings, conservative capital management, and a stable dividend.

This quarter didn’t redefine the company—but it didn’t need to.

Instead, it reinforced that BofA’s risk-reward profile is built on durability rather than excitement.

At around $50–51 post-earnings, shares sit close to their $51 fair value, leaving modest upside but strong downside support. For long-term investors comfortable with financial-cycle volatility, BofA remains a hold with opportunistic accumulation on dips below $48.


Call to Action

If you find this style of earnings-driven, valuation-based analysis helpful, follow SWOTstock for more breakdowns across banks, tech, and industrials—always grounded in official filings and management commentary.


Disclaimer

This article is for informational and educational purposes only. It does not constitute investment advice or a recommendation to buy or sell any securities. All analysis is based solely on Bank of America’s official Q3 2025 financial results and publicly available management commentary. Investors should conduct their own research or consult a licensed advisor before making investment decisions.


Morgan Stanley Q2 2025: Trading Strength Offsets IB Weakness, But Market Stays Cautious

Morgan Stanley reported strong Q2 2025 results, with $16.8B revenue and $2.13 EPS, surpassing expectations. Wealth Management added $59B in assets, while trading revenues increased. Despite a 5% drop in investment banking fees, the firm raised its dividend and initiated a $20B buyback, reflecting ongoing shareholder commitment. Shares fell post-announcement amid market caution.

TL;DR Summary

Morgan Stanley delivered a strong Q2 2025, with $16.8 B revenue and EPS of $2.13, both above expectations. Wealth Management inflows of $59 B and robust trading performance offset a 5% decline in investment banking fees. The firm also raised its dividend to $1.00/share (yielding ~2.8%) and approved a $20 B share buyback, underscoring its commitment to returning capital. Despite these positives, shares slipped ~1–2% post‑earnings, reflecting cautious sentiment around capital markets headwinds. Our fair value estimate remains ~$144, near current levels, with upside tied to a revival in dealmaking and continued strength in Wealth Management.


Quarter Recap

Morgan Stanley reported net revenues of $16.8 B, up 12% YoY, and EPS of $2.13, beating consensus by 7.6%. ROTCE reached 18.2%, reaffirming the firm’s profitability strength.

Wealth Management added $59 B in net new assets, partially offset by $22 B in tax-related outflows. Trading was a bright spot: equities revenue came in at ~$3.7 B (+23% YoY) and fixed income at ~$2.2 B (+9%). These gains helped offset investment banking fees, which fell ~5% YoY and remain below pre‑2022 levels.

Capital returns were a highlight: the board approved a quarterly dividend increase to $1.00/share (yielding ~2.8% at current prices) and a $20 B share repurchase program, beginning in Q3 2025.


Key Highlights

  • Revenue: $16.8 B (+12% YoY)
  • EPS: $2.13 (+7.6% above consensus)
  • ROTCE: 18.2%
  • Wealth Management: $59 B net new assets, offset by $22 B in tax outflows
  • Trading: Equities $3.7 B (+23%); Fixed income $2.2 B (+9%)
  • Investment Banking: Down ~5% YoY; still lagging pre‑2022 levels
  • Capital Returns: Dividend raised to $1.00/share (~2.8% yield)$20 B buyback approved
Line chart showing Morgan Stanley’s revenue and net income over the past five quarters, highlighting growth in Q2 2025.

Peer Comparison

Morgan Stanley’s steady, wealth-led approach continues to differentiate it. But when comparing to peers, Goldman Sachs grew investment banking revenue ~26% YoY, while Morgan Stanley saw a 5% decline. JPMorgan also outpaced MS in advisory and underwriting activity. This highlights a strategic trade‑off: Morgan Stanley prioritizes stable Wealth Management growth, sacrificing some upside in deal-driven businesses.

Bar chart comparing Morgan Stanley, Goldman Sachs, and JPMorgan for Q2 2025: Investment banking revenue change (%, orange bars) and wealth management inflows ($B, teal bars).

SWOT Analysis

Morgan Stanley’s Q2 shows why the market reacted cautiously: the firm delivered solid results, but investors remain concerned about weaker capital markets revenue and near-term growth visibility.

Strengths (+$4 to +$8):

  • Wealth inflows: $59 B new assets despite tax-related outflows
  • Trading strength: Equities +23%, Fixed Income +9% YoY
  • Capital returns: Dividend raised to $1/share (~2.8% yield) and $20 B buyback
  • Strong profitability: ROTCE at 18.2%, EPS beat of 7.6%

Weaknesses (−$3 to −$6):

  • Investment banking lag: −5% YoY vs Goldman’s +26%
  • Expense growth: Costs rising faster than some revenue lines
  • Client outflows: Tax outflows muted net inflow impact

Opportunities (+$3 to +$7):

  • Cross-selling E*TRADE clients within Wealth Management
  • Tech and AI investments to enhance operating leverage
  • Rebound in IPO/M&A could significantly lift investment banking revenues

Threats (−$4 to −$7):

  • Macro risks: Slowing economy could cut dealmaking & trading volumes
  • Regulatory pressures: Higher capital requirements could restrict buybacks
  • Competitive fee pressure: Margin erosion in Wealth Management & brokerage

Net SWOT price impact: −$7 to +$8 (implying short-term trading range between ~$136 and $151).


SWOT Table

Morgan Stanley Q2 2025 SWOT analysis table showing strengths, weaknesses, opportunities, and threats with estimated stock price impact ranges.
Horizontal bar chart showing Morgan Stanley Q2 2025 SWOT price impact ranges with consistent label spacing and X-axis starting at -6%.

Valuation Scenarios

Current price: ~$143.56

  • Bull Case (30%):
    IB revenue rebounds +5%, WM inflows >$50 B/quarter, ROTCE >18%.
    Target: $162
  • Base Case (50%):
    Stable WM inflows, trading moderates, IB remains sluggish.
    Target: $144
  • Bear Case (20%):
    WM growth slows, trading revenue drops, regulatory capital costs rise.
    Target: $121

Probability‑weighted fair value:(0.3 × 162) + (0.5 × 144) + (0.2 × 121) = **$144.3**

Fair value: ~$144
Assessment: Fairly valued. Any upside depends on an M&A/IPO rebound and sustained asset growth in Wealth Management.

Bar chart showing Morgan Stanley Q2 2025 valuation scenarios: Bear case at $121, Base case at $144, Bull case at $162, with a dotted line indicating fair value at $144.3.

12‑Month Outlook

Looking ahead, Morgan Stanley’s fortunes will hinge on:

  • Capital markets recovery: IPO/M&A activity improving in 2026 could reaccelerate IB revenue.
  • Sustained Wealth inflows: Maintaining $50 B+/quarter will support fee growth and capital returns.
  • Regulatory clarity: New capital requirements could affect buyback pace.

Verdict

Morgan Stanley remains a defensive, shareholder-friendly play, with stable wealth-led earnings and enhanced capital returns. While near-term upside is capped by muted deal activity, long-term investors benefit from solid dividends, repurchases, and consistent profitability.


Call to Action

Are you bullish on Morgan Stanley’s wealth-first strategy? Drop your thoughts below, and subscribe for more SWOT-driven earnings breakdowns to help you invest smarter.


Disclaimer

This analysis is based solely on Morgan Stanley’s official Q2 2025 financial report and earnings call transcript. It is for informational purposes only and is not investment advice.


Leave a comment


Cisco Q3 FY2025: Dividend Still Solid, Value Emerging — But Is the Splunk Deal a Risk or Reward?

Cisco reported strong Q3 FY2025 results with revenue of $14.15 billion and an EPS of $0.96, beating expectations. The Splunk acquisition offers growth opportunities despite integration risks. The stock is fairly valued at ~$61, providing a 2.6% dividend yield, making it appealing for long-term investors, despite macroeconomic and competitive threats.

Key Takeaways for Income & Value Investors

Cisco (NASDAQ: CSCO) delivered a strong Q3 FY2025, beating expectations and reaffirming its role as a dividend staple. The completed Splunk acquisition adds risk—but also opportunity in cybersecurity and observability. At ~$61, the stock appears fairly valued, with solid yield, modest upside, and limited downside—making it attractive for long-term dividend investors.


Cisco Q3 2025 Earnings Summary

  • Revenue: $14.15 billion (+11% YoY)
  • Non-GAAP EPS: $0.96 (vs. $0.92 guidance)
  • GAAP EPS: $0.62
  • Operating cash flow: $5.2 billion
  • Dividend paid: $1.6 billion
  • Share repurchases: $1.5 billion
  • Free cash flow payout ratio: ~61%
  • Forward dividend yield: ~2.6%
  • Free cash flow yield: ~6.8% (on trailing FCF of ~$15B)
ine chart showing Cisco’s revenue growth and non-GAAP EPS trends over the last five quarters, highlighting consistent financial performance through Q3 FY2025.

Key Highlights This Quarter

  • AI Orders Surge: $600M+ in Q3, exceeding $1B fiscal YTD
  • Capital Return: $3.1B to shareholders (buybacks + dividends)
  • Splunk Acquisition: $28B deal now closed, expanding security + analytics
  • FY2025 Guidance Raised: Modest bump in revenue and earnings outlook
  • CFO Change: Mark Patterson to succeed Scott Herren in July

SWOT Analysis (Based on Cisco’s Official Earnings Report & Call)

Strengths

Cisco remains a cash flow powerhouse with predictable returns. It beat guidance, raised full-year forecasts, and maintained a consistent capital return policy. AI orders and secure networking sales accelerated.

Estimated Stock Price Impact: +$8 to +$12

Weaknesses

The security portfolio underperformed, and the integration of Splunk introduces both cultural and execution risks. These could delay synergy realization or weigh on margins short-term.

Estimated Stock Price Impact: –$4 to –$6

Opportunities

Cisco’s software transition, fueled by Splunk, gives it greater recurring revenue potential. Emerging bets like quantum computing and AI-integrated infrastructure add long-term optionality.

Estimated Stock Price Impact: +$5 to +9

Threats

Enterprise IT spending remains vulnerable to macro pressures. Cisco also faces intense competition from hyperscalers and specialized security firms. The CFO transition may cause short-term strategic jitters.

Estimated Stock Price Impact: –$5 to –$8


SWOT Summary Table

SWOT CategoryKey DriverEst. Stock Price Impact
StrengthsEarnings beat, AI orders, dividend reliability+8 to +12
OpportunitiesSoftware shift, Splunk synergy, R&D expansion+5 to +9
WeaknessesSecurity miss, integration risk–4 to –6
ThreatsMacro exposure, competition, leadership change–5 to –8

Horizontal bar chart illustrating Cisco’s estimated stock price impact by SWOT category—Strengths, Weaknesses, Opportunities, and Threats—with clearly labeled ranges.

Cisco Stock Valuation Scenarios Based on FY2025 Guidance

ScenarioEPS (FY25E)P/E MultiplePrice TargetProbabilityWeighted Value
Base Case$3.7816x$60.4860%$36.29
Bull Case$3.9018x$70.2025%$17.55
Bear Case$3.6014x$50.4015%$7.56

Probability-Weighted Fair Value: ≈ $61.40
Current Price: $61.29


Dividend & Value Snapshot

FactorSWOTstock Assessment
Dividend Yield~2.6%, well-covered by FCF
Free Cash Flow TrendStrong ($5.2B this quarter)
Dividend Growth HistoryConsistent increases since 2011
Valuation vs. PeersCompetitive vs. IBM, Juniper, and Broadcom
Short-Term UpsideModerate if Splunk execution improves
Downside RiskLimited barring macro deterioration

Peer Comparison Snapshot

CompanyYieldP/E (fwd)Dividend GrowthBalance Sheet Strength
Cisco2.6%~16xConsistentVery Strong
IBM3.4%~15xModestModerate
Juniper2.9%~14xFlatModerate

Entry Strategy – Optional Price Zones

  • Buy Below $58: More favorable value with >3% yield
  • Hold Near $61: Fair value supported by FCF and guidance
  • Trim Above $65: Price may run ahead of fundamentals without improved security results

Verdict

At $61.29, Cisco is fairly valued. It offers:

  • A sustainable 2.6% dividend backed by robust FCF
  • Upside potential tied to AI, Splunk, and enterprise cloud adoption
  • Low downside risk for investors seeking capital preservation and steady income

This isn’t a deep value pick—but it’s a solid hold or add-on-dips candidate for dividend-focused portfolios.


Subscribe for No-Jargon, Real-Earnings Analysis

Get breakdowns tailored to real investors—no jargon, no hype.
Follow @SWOTstock or subscribe to our blog for structured, honest takes on earnings.


Disclaimer

This is not investment advice. All analysis is based solely on Cisco’s official financial report and earnings call transcript. Always do your own due diligence.


Leave a comment

Leave a comment