American Express Q4 2025: Premium Growth Holds — But Is the Stock Fully Priced?

American Express reported strong Q4 2025 results, highlighting robust premium spending and cardmember engagement. Despite growth in revenue and earnings, higher expenses posed challenges. Management remains optimistic about future growth but acknowledges valuation concerns. The stock is deemed fair to slightly expensive, with better opportunities expected during market downturns.

TL;DR Summary

  • American Express (AXP:NYSE) delivered another solid quarter, driven by resilient premium spending and strong cardmember engagement.
  • Management guided to continued revenue and EPS growth in 2026, but higher investment and normalizing credit costs remain a headwind.
  • At current levels, the stock looks fair to slightly expensive, with better risk–reward on pullbacks.

Quarter Recap

American Express Company reported Q4 2025 and full-year results that were fundamentally strong, yet met with a cautious market response. Revenue growth remained healthy, supported by Travel & Entertainment spending and a premium customer mix, while earnings landed slightly below expectations due to higher expenses. Management emphasized that credit trends are normalizing rather than deteriorating and reiterated confidence in the long-term earnings trajectory.


Key Highlights

  • Revenue grew at a double-digit pace year over year, reflecting continued strength in premium consumer spending.
  • Full-year earnings reached a record level, supported by fee income and cardmember engagement.
  • Credit performance remained within management’s expected range, consistent with a return to pre-pandemic loss patterns.
  • Ongoing investments in rewards, marketing, and technology weighed modestly on near-term margins.
  • Capital returns through buybacks and dividends remain a core part of the shareholder story.

SWOT Analysis

American Express continues to stand out as a high-quality financial franchise with a differentiated premium model. However, valuation sensitivity has increased as investors focus more on cost discipline and credit normalization rather than pure top-line growth.
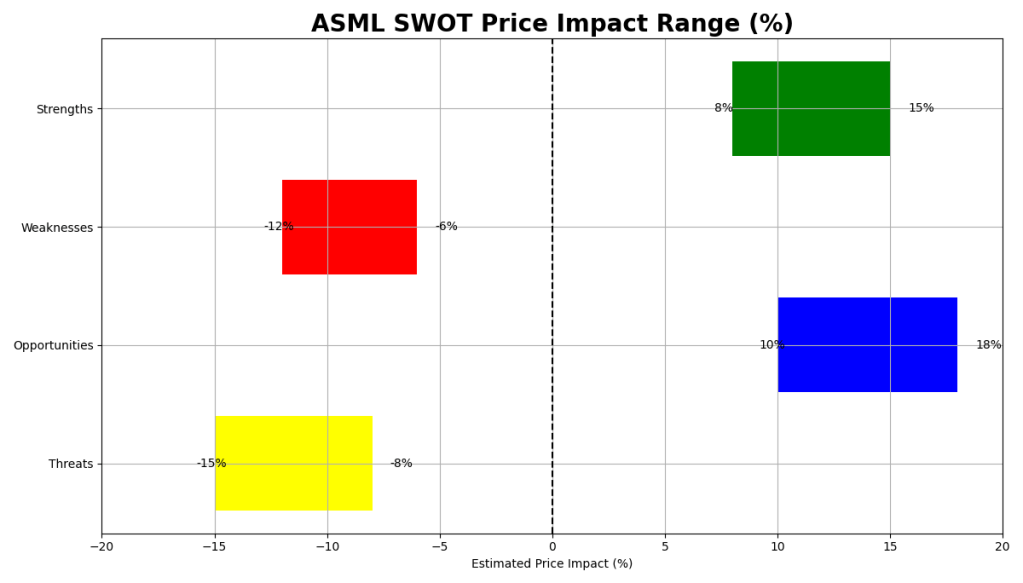
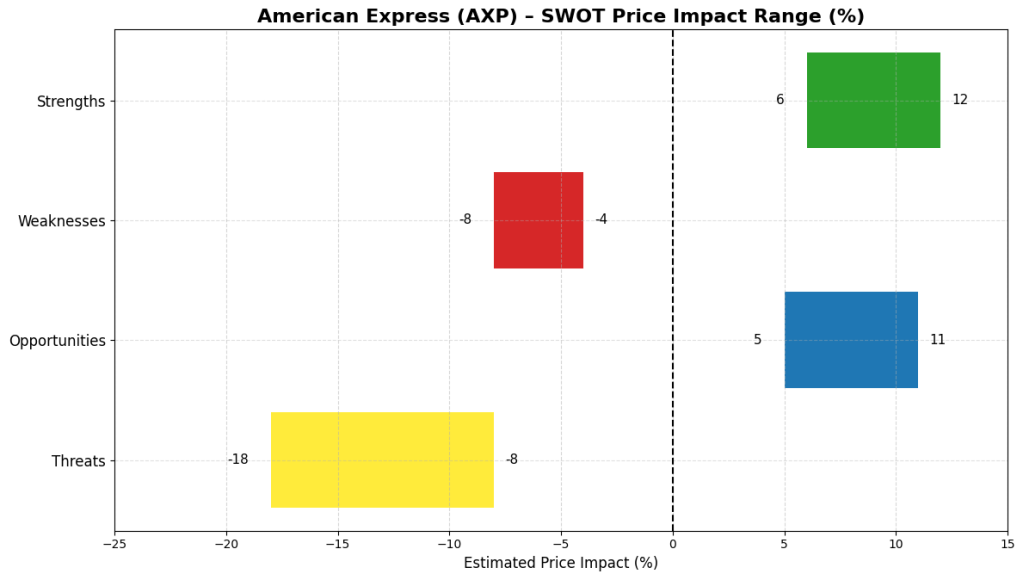
Strengths

  • Affluent customer base with resilient Travel & Entertainment spending, supporting earnings durability (+6% to +12%).
  • Sticky membership model with annual fees and rewards, driving strong lifetime value and pricing power (+4% to +9%).
  • Clear medium-term growth outlook anchored by management’s 2026 guidance (+5% to +10%).

Weaknesses

  • Elevated marketing and reward investments can pressure margins and lead to small EPS misses (−4% to −8%).
  • Combined network, issuing, and credit exposure makes earnings more sensitive to credit normalization (−3% to −7%).

Opportunities

  • Continued acquisition of Millennials and Gen Z customers enhances long-term earnings power (+5% to +11%).
  • Premium product refreshes can lift engagement, fees, and spending per cardmember (+3% to +8%).

Threats

  • Regulatory scrutiny and policy headlines can weigh on sentiment even without immediate financial impact (−6% to −15%).
  • A macro slowdown could dampen Travel & Entertainment spend and accelerate credit costs (−8% to −18%).
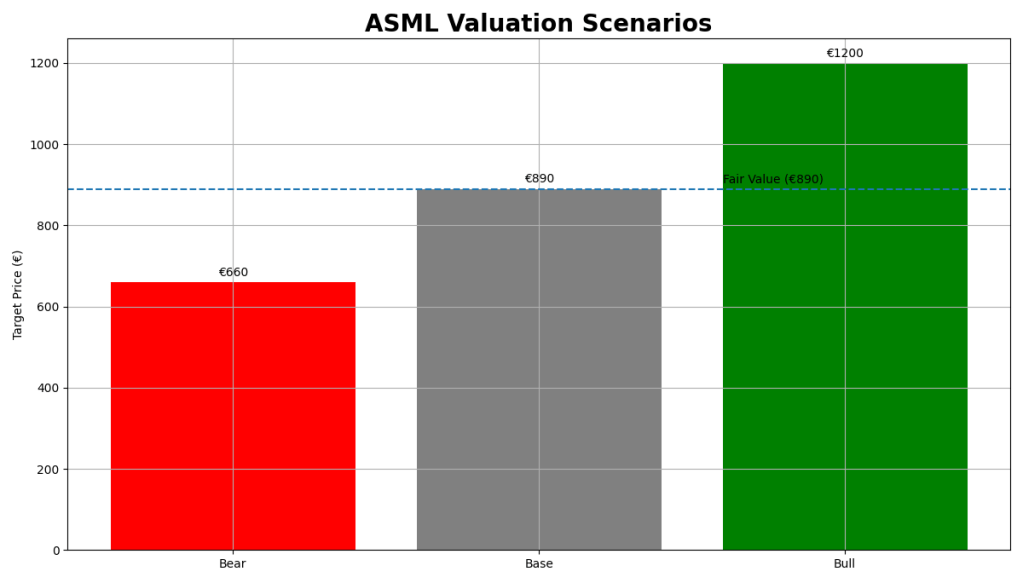
American Express SWOT price impact chart showing estimated upside and downside ranges from strengths, weaknesses, opportunities, and threats after Q4 2025 earnings.
American Express (AXP) SWOT analysis visualizing estimated stock price impact ranges from key strengths, weaknesses, opportunities, and threats based on Q4 2025 earnings.

Valuation Scenarios

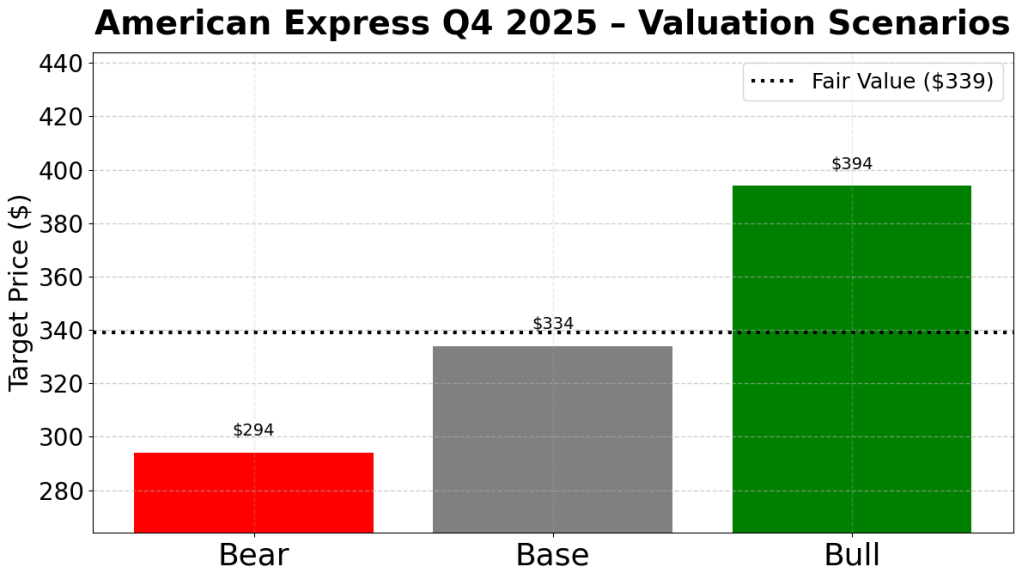
Using management’s 2026 EPS guidance and a range of reasonable valuation multiples, the stock’s upside and downside can be framed as follows.

Bear Case

  • EPS at the low end of guidance with multiple compression.
  • Implied value around $294, reflecting credit and cost concerns.

Base Case

  • Midpoint EPS with a normalized premium multiple.
  • Implied value around $334, assuming steady execution and controlled investments.

Bull Case

  • High-end EPS with multiple expansion driven by premium growth re-rating.
  • Implied value around $394, assuming strong affluent spending and operating leverage.

Probability-weighted fair value

  • Combining these scenarios yields a fair value estimate of around $340.
American Express valuation scenarios chart showing bear, base, and bull price targets with a probability-weighted fair value after Q4 2025 earnings.
American Express (AXP) valuation scenarios illustrating bear, base, and bull price targets and the probability-weighted fair value based on Q4 2025 earnings.

Verdict

American Express remains a best-in-class consumer finance franchise with durable growth drivers and strong capital returns. However, at current prices, much of that quality is already reflected in the stock. For value-oriented investors, the shares look fair to slightly expensive, with a more attractive entry point likely emerging during periods of market volatility or macro-driven pullbacks.


Call to Action

If you’re tracking high-quality financial stocks through the cycle, follow SWOTstock for clear, earnings-driven analysis that separates long-term fundamentals from short-term noise.


Disclaimer

This article is for informational and educational purposes only and does not constitute investment advice. Investors should conduct their own research and consider their financial situation and risk tolerance before making investment decisions.


ASML Q4 2025: Record AI Orders, But Is the Stock Pricing Perfection?

ASML recorded €13.2B in new bookings in Q4 2025, driven by AI semiconductor demand, pushing its backlog to nearly €39B. However, the stock trades above calculated fair value, emphasizing reliance on High-NA EUV adoption and sustained AI capital expenditure. Valuation risks and geopolitical threats could impact future returns.

TL;DR Summary

ASML just reported record bookings driven by AI-related semiconductor demand, reinforcing its role as the critical infrastructure supplier to advanced chip manufacturing. However, the stock is already trading well above our calculated fair value, meaning future returns now depend on High-NA EUV adoption and sustained AI capex growth exceeding already-lofty expectations.


Quarter Recap

ASML delivered a strong Q4 2025 report, with revenue reaching €9.7B and gross margins holding above 52%, a rare level of profitability for capital equipment companies. The headline number was bookings: €13.2B in new orders, more than doubling expectations and pushing backlog to nearly €39B. Management guided 2026 revenue to €34–39B, signaling continued demand from AI-driven chip investments.

This quarter confirmed that ASML is no longer a purely cyclical semiconductor equipment supplier; it is increasingly viewed as a structural AI infrastructure enabler.


Key Highlights

• Record quarterly bookings driven by EUV demand

• Strong margin stability above 50%

• Backlog provides multi-quarter revenue visibility

• 2026 guidance above prior expectations

• Services and installed base growing as recurring revenue stream


SWOT Analysis

ASML sits at the center of the AI semiconductor supply chain. The business shows structural strengths, but valuation risk is becoming more relevant as expectations rise.

Strengths

• EUV monopoly with pricing power → +8% to +15% price impact

• Record bookings visibility → +6% to +10%

• High gross margins (~52%) → +4% to +7%

• Large backlog reducing cyclical risk → +5% to +9%

Weakness

• Heavy reliance on few mega customers → –5% to –9%

• Long lead times cause revenue timing swings → –3% to –6%

• Elevated valuation multiples → –6% to –12%

Opportunities

• High-NA EUV adoption cycle → +10% to +18%

• AI data center chip demand → +7% to +14%

• Services growth from installed base → +4% to +8%

Threats

• China export restrictions → –7% to –13%

• Semiconductor capex downturn risk → –8% to –15%

• Geopolitical supply chain risks → –4% to –8%

ASML SWOT price impact chart showing strengths (+8% to +15%), opportunities (+10% to +18%), weaknesses (–12% to –6%), and threats (–15% to –8%) with a zero baseline, illustrating potential valuation drivers and risks after the latest earnings.
ASML SWOT price impact ranges: Structural strengths from EUV monopoly and AI demand provide upside potential, while valuation risk, customer concentration, and export restrictions represent key downside factors.

Valuation Scenarios

ASML’s valuation reflects its position as a toll collector on advanced chip manufacturing rather than a traditional cyclical equipment maker.

Bear Case

AI spending slows, High-NA adoption delayed, and multiples compress.

→ –20% to –30% downside

Base Case

Steady AI demand, gradual High-NA ramp, stable margins.

→ +10% to +18% upside

Bull Case

Accelerated AI infrastructure buildout and faster High-NA adoption.

→ +30% to +45% upside

Probability-weighted expected return: ~+10–12%

ASML valuation scenarios chart showing Bear case at €660, Base case fair value at €890, and Bull case at €1200, with a dashed fair value line illustrating potential upside and downside based on AI demand and semiconductor cycle assumptions.
ASML valuation scenarios: The base case fair value centers around €890, with downside risk if AI spending slows and upside potential if High-NA EUV adoption and global AI infrastructure investment accelerate.

Verdict

ASML remains one of the most strategic companies in the global technology supply chain. However, with shares trading well above our fair value estimate of €880–900 (≈ $1,040–1,065), the stock appears priced for a strong AI expansion scenario. Investors are now paying for execution perfection.


Call to Action

Follow SWOTstock for structured, fundamentals-driven breakdowns that cut through earnings hype and focus on valuation, risk, and long-term positioning.


Disclaimer

This analysis is for informational purposes only and does not constitute investment advice. Investors should conduct their own research and consider risk tolerance before making investment decisions.


Goldman Sachs Q4 2025: Earnings Power Is Back — Valuation Now Demands Durability

Goldman Sachs reported a strong Q4 2025, highlighting a recovery in capital markets with net revenues of $13.45 billion and net income of approximately $4.6 billion. The stock is now valued on sustained earnings strength, with future returns dependent on the durability of this recovery. Key opportunities and threats are outlined in a SWOT analysis.

TL;DR

Goldman Sachs (GS:NYSE) delivered a strong Q4 2025, confirming that capital markets activity has meaningfully recovered and earnings power has re-emerged. At today’s price, GS is no longer a balance-sheet or re-rating story. The stock is valued on sustained earnings strength, with future returns increasingly dependent on how durable this recovery proves to be through the next cycle.


Quarter Recap

Goldman Sachs closed out 2025 with a solid fourth quarter, reflecting improved client engagement across Investment Banking and Global Markets. Revenues rebounded, profitability strengthened, and returns moved back into the mid-teens. Management commentary pointed to healthier capital markets conditions and disciplined capital deployment, reinforcing the sense that GS has exited its post-cycle trough.


Key Highlights

  • Q4 net revenues: $13.45bn, driven by stronger Investment Banking and Markets activity
  • Net income: ~$4.6bn
  • EPS: $14.01, up meaningfully year over year
  • Annualized ROE: ~16%, back above through-cycle targets
  • Book value per share: $357.60
  • Quarterly dividend increased to: $4.50, signaling confidence in earnings durability

SWOT Analysis

At current valuation levels, Goldman Sachs is being priced primarily on normalized earnings power, not balance-sheet metrics. The SWOT below reflects that shift.

Strengths

Goldman’s core franchise is reasserting itself as capital markets normalize, with operating leverage returning across its most profitable businesses.

  • Investment Banking and trading rebound driving earnings momentum (+6% to +10%)
  • Mid-teens ROE supports a premium earnings multiple (+4% to +7%)

Weaknesses

Despite improvement, earnings remain inherently cyclical and sensitive to market conditions.

  • Revenue volatility tied to deal flow and trading activity (-6% to -10%)
  • Asset & Wealth Management margins remain below peak potential (-3% to -5%)

Opportunities

If capital markets recovery proves durable, earnings power could exceed current expectations.

  • Sustained M&A and issuance activity into 2026 (+8% to +14%)
  • Continued dividend growth and buybacks supporting total returns (+3% to +6%)

Threats

At current valuation levels, downside risk increases if the cycle turns earlier than expected.

  • Macro or market shock reducing client activity (-12% to -20%)
  • Regulatory or capital rule changes constraining ROE and payout capacity (-4% to -7%)
SWOT price impact range chart for Goldman Sachs Q4 2025, showing estimated percentage impact of strengths, weaknesses, opportunities, and threats on the share price.
SWOT price impact ranges highlight that Goldman Sachs’ upside is driven by capital markets recovery and earnings leverage, while downside risk remains tied to cycle sensitivity and macro conditions.

Valuation Scenarios

With GS trading far above book value, valuation should be framed around normalized earnings, not balance-sheet multiples.

Bear Case (~$675)

This scenario assumes the current capital markets rebound fades as macro conditions tighten.

  • Normalized EPS declines toward ~$45
  • Investment Banking and trading activity cool meaningfully
  • Operating leverage works in reverse, pressuring margins
  • Valuation compresses to ~15× earnings, typical of late-cycle conditions

Base Case (~$935)

The base case assumes capital markets stabilize at healthier, mid-cycle levels.

  • Normalized EPS of ~$52, broadly in line with FY 2025 earnings power
  • Deal activity and trading remain solid but not overheated
  • The stock trades at ~18× earnings, reflecting franchise strength with cyclical risk

Bull Case (~$1,160)

The bull case assumes a sustained and broad-based capital markets recovery.

  • Normalized EPS rises toward ~$58
  • Strong M&A, IPO, and trading activity drive operating leverage
  • Valuation expands to ~20× earnings on improved earnings visibility

Probability-Weighted View

  • Bear: 25%
  • Base: 50%
  • Bull: 25%

Probability-weighted fair value: ~$950

Valuation scenarios bar chart for Goldman Sachs Q4 2025 showing bear, base, and bull target prices with a dotted fair value line.
Valuation scenarios show Goldman Sachs trading near base-case assumptions, with upside tied to sustained earnings power and downside risk if capital markets momentum fades.

Verdict

Goldman Sachs has transitioned from a recovery story to an earnings-power story. At current levels, the stock appears fairly valued on normalized earnings, with upside now dependent on sustaining capital markets momentum rather than further multiple expansion. GS remains a high-quality franchise, but future returns will increasingly reflect execution and cycle durability.


Call to Action

If you’re tracking U.S. banks and capital markets exposure, follow SWOTstock for earnings-driven analysis that focuses on valuation realism — not headline noise.


Disclaimer

This content is for informational purposes only and does not constitute investment advice. Investors should conduct their own research.