TL;DR Summary
Alphabet (GOOGL:NASDAQ) delivered a strong Q4 FY2025 earnings report that reassured investors on three critical fronts: Search monetization remains intact, Google Cloud is now a real profit engine, and AI investment—while heavy—is disciplined and demand-driven. The stock reaction suggests the market sees Alphabet as a durable growth platform rather than a business being disrupted by generative AI. Fair value sits modestly above current levels, with upside tied to successful AI monetization.
Quarter Recap
Alphabet reported Q4 FY2025 earnings on February 4, 2026, after market close. The quarter covered both Q4 results and full-year performance, offering investors a clean read on how Alphabet is balancing aggressive AI investment with earnings quality.
Revenue grew at a healthy double-digit pace, operating margins expanded year over year, and earnings per share outpaced revenue growth. Importantly, management used this quarter to reframe the AI narrative—from cost burden to long-term monetization engine—without glossing over the scale of near-term investment.
Key Highlights
- Search and Ads continued to deliver resilient growth, with management emphasizing AI-driven improvements in ad relevance and conversion.
- YouTube saw stabilizing ad trends alongside steady subscription growth, reinforcing its dual monetization model.
- Google Cloud posted strong growth and, more importantly, sustained operating profitability, supported by rising AI workloads.
- AI infrastructure spending remained elevated, but management stressed that CapEx is tied to visible demand and improving efficiency.
- Capital returns continued through buybacks and dividends, supporting EPS growth even amid heavy investment.
SWOT Analysis
Alphabet’s current setup reflects a company defending a powerful core business while investing aggressively to secure its next growth phase. The earnings reduced downside fears but sharpened the debate around AI return on investment.
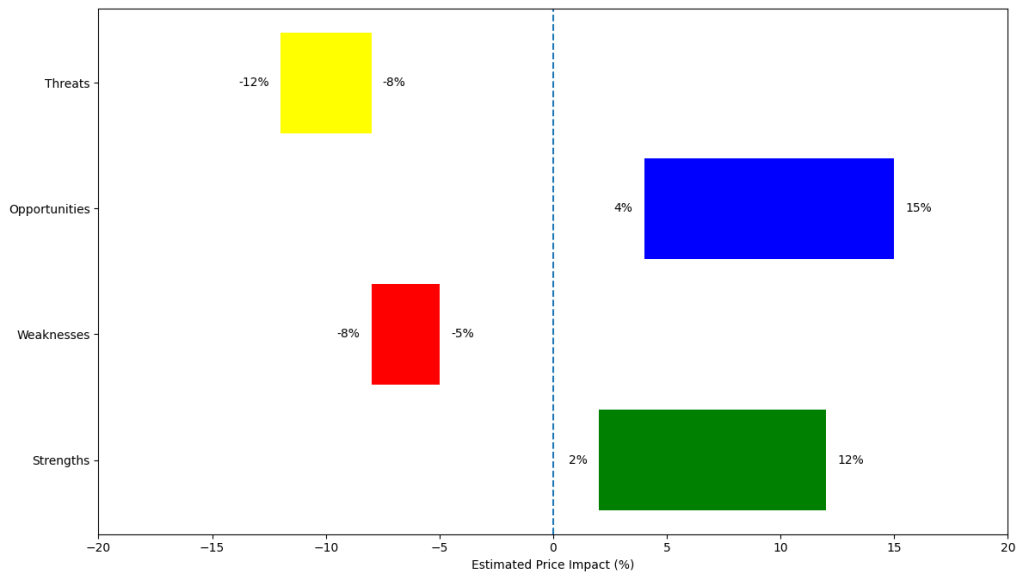
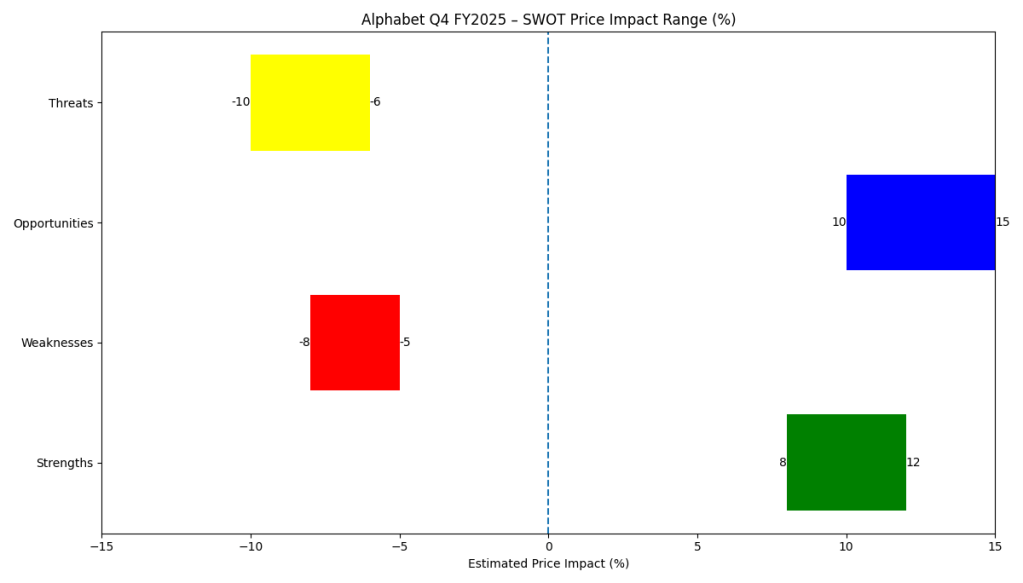
Strengths
- Search and Ads durability
AI is enhancing monetization rather than disrupting it, reinforcing Alphabet’s core cash engine.
Estimated price impact: +8% to +12% - YouTube’s scale and monetization breadth
Ads stabilization and subscription growth provide steady operating leverage.
Estimated price impact: +4% to +6% - Google Cloud profitability inflection
Cloud is now a meaningful contributor to operating income, not just a growth story.
Estimated price impact: +7% to +10%
Weaknesses
- High AI-driven CapEx
Front-loaded infrastructure spending weighs on near-term free cash flow optics.
Estimated price impact: −5% to −8% - Advertising revenue concentration
Despite diversification, Ads still dominate investor perception.
Estimated price impact: −3% to −5%
Opportunities
- AI monetization across products
Gemini-powered features can lift ad ARPU and enterprise pricing over time.
Estimated price impact: +10% to +15% - AI-led Cloud mix improvement
Higher-value AI workloads support long-term margin expansion.
Estimated price impact: +6% to +9% - Ongoing capital returns
Buybacks and dividends enhance EPS growth and valuation support.
Estimated price impact: +3% to +5%
Threats
- Regulatory and antitrust risk
Structural remedies remain a persistent tail risk.
Estimated price impact: −6% to −10% - Intensifying AI competition
Pressure from hyperscalers and model providers could limit returns on AI spend.
Estimated price impact: −4% to −7% - AI execution risk
Delayed monetization could lead to multiple compression.
Estimated price impact: −5% to −8%
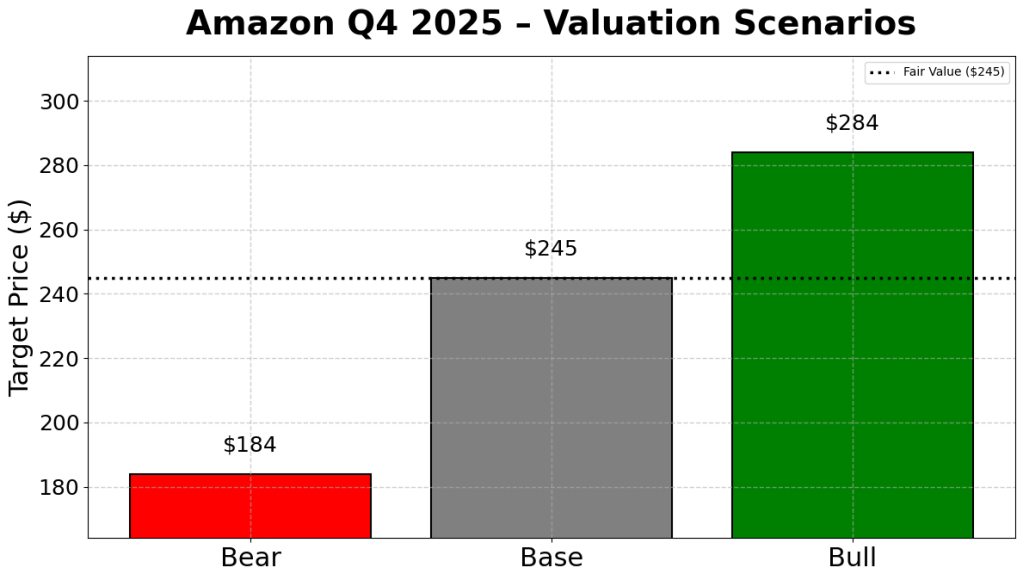
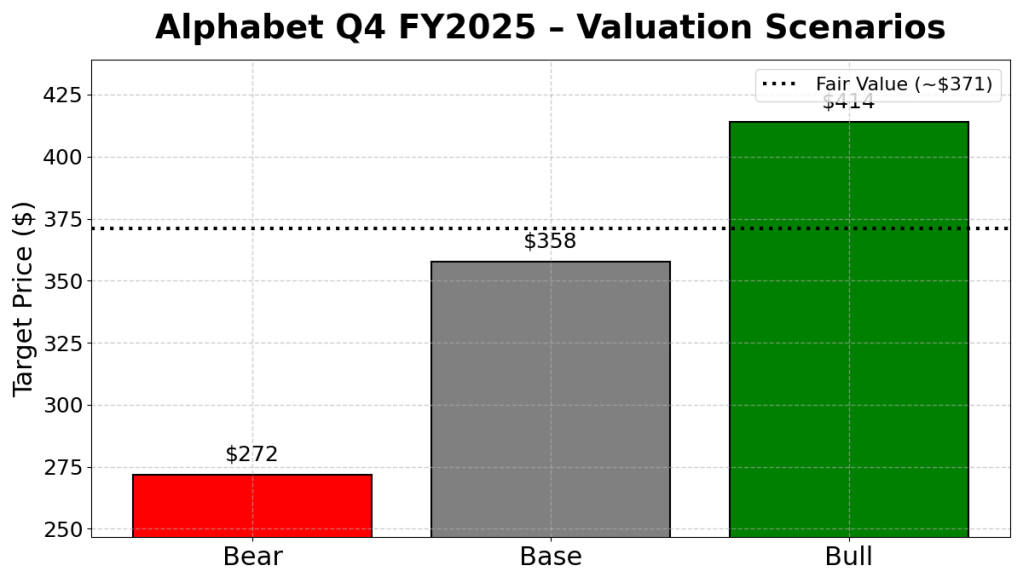
Valuation Scenarios
Alphabet’s valuation hinges on whether AI investment is seen as a temporary drag or a durable value creator.
Bear Case
Slower Search growth, delayed AI monetization, and Cloud margin stagnation drive multiple compression.
Implied outcome: −15% to −20%
Base Case
Search remains stable, Cloud margins improve gradually, and AI monetization ramps steadily.
Implied outcome: +5% to +10%
Bull Case
AI meaningfully lifts ad economics and accelerates Cloud margin expansion, prompting multiple expansion.
Implied outcome: +20% to +30%
Probability-weighted fair value: Approximately 10%–15% above current trading levels.
Verdict
Alphabet is not a deep value play, but it is a high-quality compounder with improving optionality. The market currently prices in durable cash generation and cautious AI upside—but not a full AI-driven re-rating. For long-term growth investors, the risk-reward profile remains attractive as long as Search economics hold and Cloud continues to scale profitably.
Call to Action
If you’re tracking how AI investment is reshaping megacap tech valuations, follow SWOTstock for earnings-driven analysis that focuses on fundamentals, not hype.
Disclaimer
This analysis is for informational purposes only and does not constitute investment advice. Always conduct your own research or consult a licensed financial professional before making investment decisions.