Oracle Q2 FY2026 — Revenue Miss, AI Backlog Surge, and a 14% Drop: Value Reset or Warning Sign?

Oracle’s Q2 FY2026 results showed mixed performance with revenue at $16.06B slightly below expectations, while adjusted EPS at $2.26 was aided by a one-time gain. A significant $523B RPO backlog indicates strong future demand, yet stock fell over 10% to ~$199 amid concerns over profitability and capital intensity.

TL;DR Summary

Oracle (NYSE: ORCL) reported mixed Q2 FY2026 results: revenue came in slightly below expectations, adjusted EPS beat but was boosted by a one-time gain, and OCI continued strong but not hyper-scale acceleration. The standout metric was a massive $523B RPO backlog, signaling powerful long-term demand for AI and cloud infrastructure. Yet the stock still dropped over 10% after hours to ~$199 as investors recalibrated near-term profitability, cloud CapEx intensity, and the quality of earnings. Our fair value stands at $210–$215, with the pullback offering a more reasonable entry point for value-oriented investors who can tolerate AI-cycle volatility.


Quarter Recap

Oracle released its Q2 FY2026 results on December 10. Total revenue reached $16.06B, a modest YoY increase but a slight miss versus expectations. Adjusted EPS beat estimates at $2.26; however, the strength was driven by a $2.7B pretax gain from selling Oracle’s stake in Ampere Computing. OCI remained a bright spot, growing roughly 68% YoY and supported by AI training and inference demand, although growth did not exceed bullish expectations.

The biggest surprise came from Remaining Performance Obligations (RPO), which surged to $523B — one of the highest forward-demand indicators in enterprise tech. Despite this, the stock sold off sharply as investors focused more on margin pressure, heavy CapEx needs, and the softer revenue print. By late after-hours trading, Oracle shares had fallen to around $199, down more than 10%.


Key Highlights

  • Revenue: $16.06B, slightly below consensus
  • Adjusted EPS: $2.26, aided by a one-time Ampere stake sale
  • OCI: ~68% YoY growth, strong but not accelerating beyond expectations
  • RPO: Jumped to $523B, signaling multi-year cloud and AI demand
  • CapEx & Debt: Rising commitments for cloud infrastructure expansion
  • Market Reaction: Stock dropped from ~$230 to ~$199 after hours

SWOT Analysis

Oracle’s Q2 results highlight a company balancing immense long-term opportunity with near-term financial strain. While the AI infrastructure cycle is driving unprecedented backlog levels, the path to monetizing this demand profitably remains uncertain. The sell-off reflects this tension: long-term durable demand on one side, and rising costs, slower revenue, and an inflated EPS figure on the other.

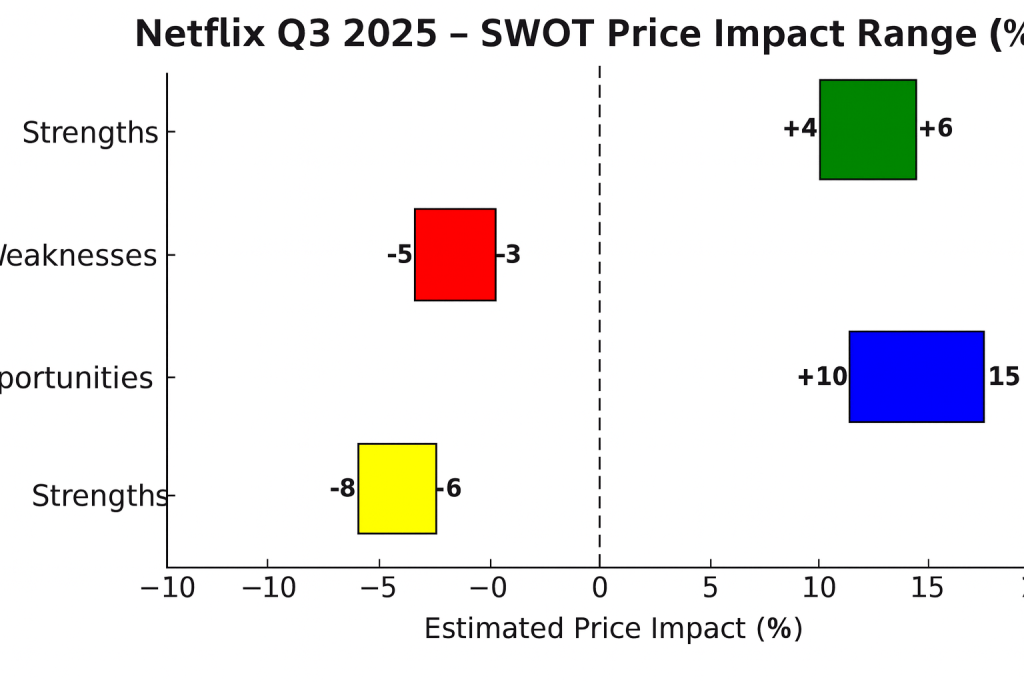
Strengths (Price Impact: +6% to +12%)

  • Massive RPO backlog of $523B supporting multi-year revenue visibility (+3% to +5%)
  • Highly sticky database and support revenue base anchoring cash flow (+2% to +4%)
  • Strong OCI growth of ~68% YoY securing relevance in AI infrastructure (+3% to +5%)
  • Consistent capital returns through buybacks and dividends (+1% to +2%)

Weaknesses (Price Impact: –6% to –12%)

  • Revenue miss relative to AI-fueled expectations (–3% to –5%)
  • EPS beat driven by one-time Ampere stake sale (–2% to –4%)
  • Near-term margin pressure from heavy cloud infrastructure investments (–3% to –5%)
  • Elevated debt profile reducing financial flexibility (–1% to –2%)

Opportunities (Price Impact: +10% to +18%)

  • Multi-year AI infrastructure demand cycle boosting OCI adoption (+5% to +8%)
  • Database migration to OCI offering structural margin lift (+3% to +5%)
  • Cerner modernization creating long-term operating leverage (+2% to +4%)
  • Enterprise consolidation driving large, integrated cloud modernization deals (+2% to +3%)

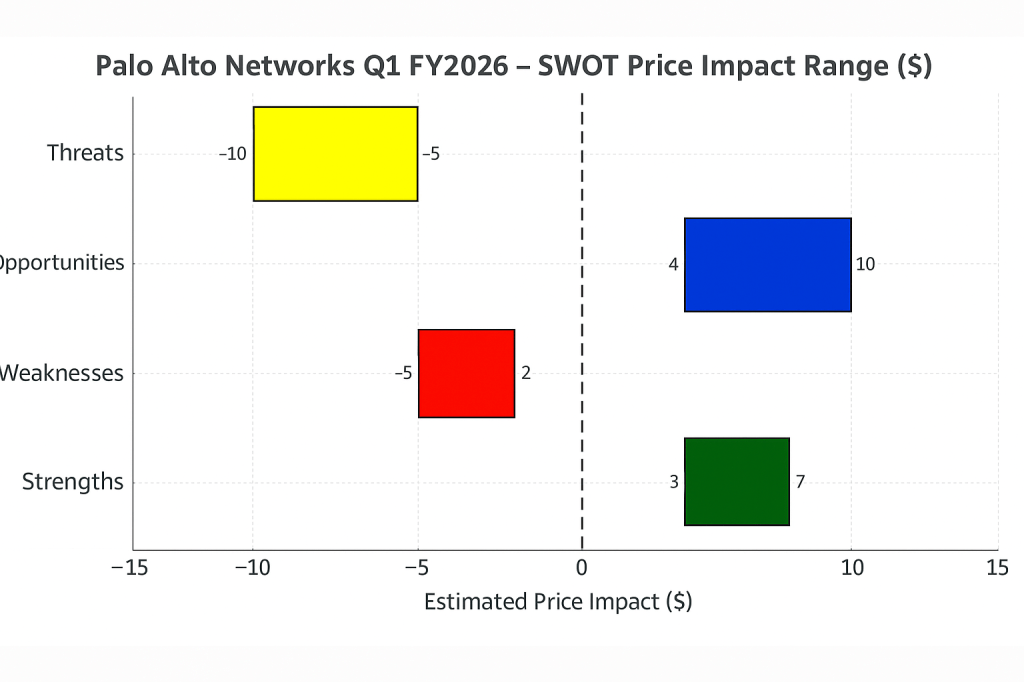
Threats (Price Impact: –12% to –20%)

  • CapEx requirements rising to fulfill massive AI/cloud backlog (–5% to –8%)
  • Fierce competition from AWS, Azure, and Google Cloud (–3% to –6%)
  • AI contract profitability still unclear and may dilute margins (–2% to –4%)
  • Macro slowdown could hit enterprise IT spending (–2% to –3%)
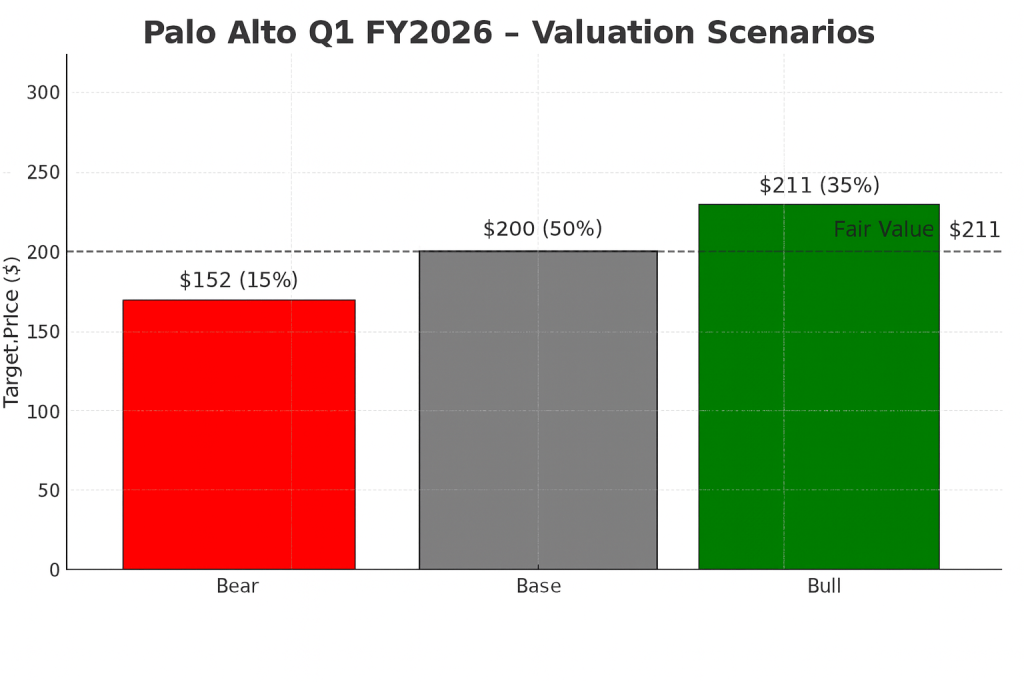
Oracle Q2 FY2026 SWOT analysis chart showing estimated stock price impact ranges: Strengths +6% to +12%, Weaknesses –12% to –6%, Opportunities +10% to +18%, and Threats –20% to –12%, displayed on a horizontal bar chart with x-axis starting at –25%.

Valuation Scenarios

With shares falling to ~$199, Oracle now trades below our intrinsic value range. The key valuation driver is how quickly OCI can scale profitably relative to the heavy CapEx needed to support long-term AI demand. Below are three scenarios based on earnings normalization, cloud margin trajectories, and the appropriate earnings multiple for a hybrid software + cloud infrastructure business.

Bear Case — $175

  • OCI slows to 40–50%
  • CapEx stays elevated for multiple years
  • Core EPS normalizes lower after removing one-time gains
  • Multiple compresses to 15× forward EPS
  • Price Target: ~$175

Base Case — $215

  • OCI grows 55–65%
  • Revenue normalizes to mid-single digits
  • CapEx moderates by FY2027
  • Margins expand gradually
  • Valuation at ~17.5× forward EPS
  • Price Target: ~$215

Bull Case — $255

  • OCI re-accelerates to 70%+
  • AI contracts become margin accretive
  • Cloud and software synergy improves profitability
  • Market assigns a premium 20× forward multiple
  • Price Target: ~$255

Fari Value

Assigning scenario probabilities:

  • Bear: 30%
  • Base: 50%
  • Bull: 20%

FV = (175 x 0.3) + (215 x 0.5) + (255 x 0.2)

= 52.5 + 107.5 + 51 = 211

🎯 Probability-Weighted Fair Value = $211

Oracle Q2 FY2026 valuation scenarios chart comparing Bear case price target $175, Base case $215, and Bull case $255, with a dashed line indicating the probability-weighted fair value of $211.

Verdict

Oracle’s Q2 numbers delivered a mixed message: enormous long-term demand but weaker near-term fundamentals. The stock’s drop to ~$199 reflects investors resetting expectations for cloud profitability and earnings quality. Still, the pullback now places Oracle below our fair value estimate, creating a potentially attractive entry point for long-term, value-oriented investors who accept AI-cycle volatility. For investors seeking steady cash flow, disciplined capital returns, and long-term cloud upside, Oracle now screens more reasonable than before.


Call to Action

If you want structured, fact-based breakdowns of every earnings season — from Big Tech to industrials to retail — subscribe to SWOTstock. We turn dense earnings reports into clear insights so you can invest with conviction, not noise.


Disclaimer

This analysis is for informational purposes only and is not financial advice. All estimates are based on publicly available company filings and earnings calls. Investors should conduct their own due diligence before making investment decisions.


Netflix Q3 2025 — “AI Meets Ad Money: A Plot Twist in the Streaming Story”

Netflix’s Q3 2025 earnings showed record revenue of $9.62 billion and operating income of $2.27 billion, although a $619 million tax hit in Brazil lowered EPS to $4.25. Management affirmed strong fundamentals, with significant ad-tier growth expected. The company is evolving towards a profit-focused model amid expansion and AI enhancements.

TL;DR Summary

Netflix’s (NASDAQ: NFLX) Q3 2025 results delivered record revenue of $9.62 billion (+12.6 % YoY) and operating income of $2.27 billion (+18 %), but a $619 million tax expense in Brazil clipped EPS to $4.25, below expectations.
Despite a 6 % after-hours drop, management reaffirmed margin and cash-flow guidance, and the ad-tier business is scaling faster than expected. The fundamentals remain strong — the market reaction was all sentiment.


Quarter Recap

  • Revenue: $9.62 B (+12.6 % YoY)
  • Operating Margin: 23.6 % (up 1.1 pts)
  • Net Income: $1.94 B (+15 %)
  • EPS: $4.25 (+14 %)
  • Free Cash Flow: $1.7 B (slightly lower on $18 B content spend)
  • Paid Memberships: 282 M (+9 %)
  • Ad-tier Share: ≈ 16 % of new sign-ups (vs 9 % in Q2)
  • Regional Growth: APAC +22 %, LATAM +18 %, EMEA +10 %, UCAN +8 %

Key Highlights and Management Comments

Greg Peters (Co-CEO):

“Our ad-supported plan is scaling faster than expected. We’re now live in 15 markets, and we expect this to be a multi-billion-dollar business by 2026.”

Spencer Neumann (CFO):

“We’re on track for roughly $7 billion in free cash flow this year, even after increasing content investment to $18 billion.”

Ted Sarandos (Co-CEO):

“AI is improving localization, dubbing, and recommendations — helping creators reach global audiences, not replacing them.”


SWOT Analysis

Before breaking down Netflix’s quarter into strengths, weaknesses, opportunities, and threats, it’s useful to step back and look at what really moved the numbers this time. Q3 2025 wasn’t a story about subscriber growth or content costs alone — it was about a business transitioning into a more diversified, margin-focused platform. The sudden tax hit added noise, but underneath, Netflix is shaping a clearer long-term trajectory.
The SWOT framework highlights how each of these forces may translate into real price impact for investors.

Strengths

  • Ad-tier scaling ahead of plan (+8 – 12 %)
  • Operating margin expanding (+4 – 6 %)
  • Solid subscriber growth (+3 – 5 %)

Weaknesses

  • Heavy content spend pressures FCF (–3 – 5 %)
  • UCAN saturation limits pricing (–2 – 3 %)

Opportunities

  • Global ad expansion (15 markets, 16 % of sign-ups) (+10 – 15 %)
  • AI-powered localization & discovery (+4 – 6 %)
  • Gaming and live content diversification (+2 – 3 %)

Threats

  • Brazil tax dispute (–6 – 8 %)
  • Streaming competition (–4 – 6 %)
  • FX headwinds in LATAM (–2 – 3 %)

Net Impact: ≈ +1.5 – 2 % upside vs current price.


SWOT Price Impact Chart for Netflix Q3 2025 showing estimated price impact ranges for each SWOT factor.


Valuation Scenarios (Q4 2025 – Mid 2026 Horizon)

With the SWOT picture in place, the next step is understanding how these drivers translate into valuation. Netflix is no longer purely a high-growth streaming play; it’s a hybrid model balancing global expansion, ad monetization, and AI-driven efficiency. Each scenario—bull, base, and bear—reflects a different path the company could take depending on execution, competitive pressure, and regulatory risks.
The following valuation scenarios show how those paths map to price targets and a probability-weighted fair value.

Bull Case (35 %)

  • Ad-tier accelerates; margin 25 % +; EPS >$6 → Target $1,450 (+17 %)

Base Case (45 %)

  • Stable 7 % subscriber growth; margin 24 % → Target $1,250 (+1 %)

Bear Case (20 %)

  • Tax drag repeats; churn rises; cost inflation → Target $1,000 (–19 %)

Fair Value: Weighted Average ≈ $1,270
Current Price: ≈ $1,240 → +2.4 % Upside

Valuation scenarios chart for Netflix Q3 2025 showing three vertical bars: Bear case ($1,000 at 20%, red), Base case ($1,250 at 45%, gray), and Bull case ($1,450 at 35%, green). A dashed horizontal line marks the fair value at $1,270, following the same format as the Palo Alto Networks valuation chart.

Valuation Scenarios Chart for Netflix Q3 2025 displaying Bear, Base, and Bull targets with a fair-value line at $1,270.


Verdict

Netflix is shifting from a subscriber-growth story to a profit-platform narrative.
The 6 % post-earnings drop looks more like a valuation reset than a fundamental issue.
If the Brazil tax charge proves one-off, Q3 2025 may mark the start of a more sustainable, AI-enhanced growth chapter.

Short-term: Hold / Accumulate on weakness
Medium-term: Attractive for growth investors eyeing AI and ad-tier upside


Call to Action

👉 Follow SWOTstock for AI-driven SWOT analyses of top global companies.
📈 Stay ahead of the market with data-driven insights simplified for retail investors.


Disclaimer

This analysis is based solely on Netflix’s official Q3 2025 financial statements and earnings call materials. It is for educational and informational purposes only and does not constitute investment advice.

Palo Alto Networks Q1 FY2026 — “Steady Growth, Strong ARR, and a Market That Wanted More”

Palo Alto Networks reported strong FY2026 Q1 results, with a 16% revenue increase to $2.50 billion and a 29% rise in NGS ARR to $5.9

TL;DR Summary

Palo Alto Networks delivered a solid first quarter for FY2026: revenue climbed 16% to $2.50 billion, NGS ARR rose 29% to $5.9 billion, and RPO expanded 24% to $15.5 billion. Non-GAAP EPS of $0.93 beat expectations, reaffirming the company’s execution as customers expand platform adoption across Strata, Prisma, and Cortex. Yet shares traded lower after earnings as full-year guidance held steady, signaling a “good but not great” quarter for a stock priced for upside surprises. Our probability-weighted fair value comes in at $211, modestly above today’s ~$200 level.


Quarter Recap

Palo Alto Networks opened fiscal 2026 with steady momentum across its recurring revenue engines. Revenue grew 16% year-on-year to $2.50 billion, reflecting consistent demand for platformized security solutions. Next-Generation Security ARR expanded 29% to $5.9 billion, and the company’s Remaining Performance Obligation reached $15.5 billion, illustrating multi-year visibility as customers commit to broader and longer-term contracts. Non-GAAP EPS of $0.93 came in ahead of expectations, supported by robust software mix and continued traction in large deals. GAAP net income softened to $334 million due to higher operating investments and recent acquisition activity. Full-year guidance was reaffirmed at 14% revenue growth and 38–39% free cash flow margin, indicating stable execution without major revisions.


Key Highlights

  • Revenue grew 16% YoY to $2.50B
  • NGS ARR increased 29% YoY to $5.9B
  • RPO reached $15.5B, up 24% YoY
  • GAAP net income: $334M
  • Non-GAAP EPS: $0.93
  • FY2026 revenue guide: $10.50B–$10.54B (~14% YoY)
  • FY2026 non-GAAP EPS guide: $3.80–$3.90
  • FY2026 FCF margin: 38–39%
  • Strong platform adoption across Strata, Prisma, Cortex
  • Deal cycles remain healthy with large multi-module wins

SWOT Analysis

Strengths (+6% to +12%)

Palo Alto’s platform strategy continues to resonate, with customers consolidating disparate tools into unified architectures across network, cloud, and SOC operations. Robust ARR and RPO growth demonstrate durable demand and expanding wallet share. Execution remains consistent, with non-GAAP EPS beating expectations and free cash flow margins reaffirmed at attractive levels.

Weaknesses (–5% to –10%)

GAAP profitability remains pressured as the company absorbs integration costs and continues its investment cycle. The flat full-year revenue outlook reflects strong but not accelerating momentum, which limits near-term operating leverage. Competition and elevated valuation require continuous outperformance to sustain premium multiples.

Opportunities (+8% to +15%)

AI-aligned security represents a significant long-term catalyst. Enterprises are rearchitecting systems to protect AI workloads, model governance, and data pipelines — opening the door for larger platform deals. If AI-driven security cycles broaden or ARR momentum accelerates, Palo Alto could benefit from expanding deal sizes and higher-margin software adoption.

Threats (–8% to –15%)

The competitive landscape remains intense, with CrowdStrike, Zscaler, Fortinet, and hyperscalers rolling out AI-native security features. Deal timing remains sensitive to macro conditions, and any slowdown in billings or ARR conversion could weigh on sentiment. With valuation elevated, even modest disappointments can trigger multiple compression.


SWOT Table

Strengths
+6% to +12%
Execution strength, ARR growth, platform adoption

Weaknesses
–5% to –10%
GAAP margin pressure, flat guide, integration costs

Opportunities
+8% to +15%
AI-security demand, larger platform deals, multi-year contracts

Threats
–8% to –15%
Intense competition, valuation risk, deal-cycle volatility

SWOT price impact chart for Palo Alto Networks Q1 FY2026 showing strengths, weaknesses, opportunities, and threats with corresponding dollar impact ranges on a horizontal bar graph.

Valuation Scenarios & Fair Value

Bull Case — $253 (35% probability)

Assumes stronger ARR expansion, AI-security deal momentum, and upside to FY26 revenue.
EPS: $3.95
Multiple: 64×
Target: $253

Base Case — $200 (50% probability)

Represents steady execution consistent with FY26 guidance.
EPS: $3.85
Multiple: 52×
Target: $200

Bear Case — $152 (15% probability)

Reflects slower deal cycles or competitive pressure leading to multiple compression.
EPS: $3.80
Multiple: 40×
Target: $152

Probability-Weighted Fair Value

0.35(253)+0.50(200)+0.15(152)=2110.35(253)+0.50(200)+0.15(152)=211

➡️ Fair Value Estimate: $211 per share

Today’s price near ~$200 suggests modest upside.

Valuation scenarios chart for Palo Alto Networks Q1 FY2026 showing bear case target of $152, base case target of $200, and bull case target of $253, with a dashed line indicating fair value at $211.”

Verdict

Palo Alto delivered a confident and well-executed quarter with strong ARR performance and healthy deal momentum. The reaffirmed full-year outlook signals stability, but the market was looking for acceleration, especially given the AI-security narrative. For long-term growth investors, the fundamentals remain compelling: resilient demand, high software mix, and strong free cash flow. With shares trading slightly below our $211 fair-value estimate, Palo Alto represents a reasonable entry point for exposure to platformized, AI-aligned cybersecurity — though upside may rely on renewed momentum in billings or a more aggressive guidance raise later in FY2026.


Call to Action

If you found this breakdown helpful, follow SWOTstock for more AI-driven fundamental analysis on today’s most important tech and cybersecurity companies. Each report is built from official filings, earnings transcripts, and a structured methodology designed for disciplined investors.


Disclaimer

This article is for informational purposes only and is not investment advice. All analysis is based exclusively on Palo Alto Networks’ official earnings report, financial disclosures, and management commentary from the latest quarter. Investors should perform their own research or consult a financial professional before making investment decisions.