Netflix Q3 2025 — “AI Meets Ad Money: A Plot Twist in the Streaming Story”

Netflix’s Q3 2025 earnings showed record revenue of $9.62 billion and operating income of $2.27 billion, although a $619 million tax hit in Brazil lowered EPS to $4.25. Management affirmed strong fundamentals, with significant ad-tier growth expected. The company is evolving towards a profit-focused model amid expansion and AI enhancements.

TL;DR Summary

Netflix’s (NASDAQ: NFLX) Q3 2025 results delivered record revenue of $9.62 billion (+12.6 % YoY) and operating income of $2.27 billion (+18 %), but a $619 million tax expense in Brazil clipped EPS to $4.25, below expectations.
Despite a 6 % after-hours drop, management reaffirmed margin and cash-flow guidance, and the ad-tier business is scaling faster than expected. The fundamentals remain strong — the market reaction was all sentiment.


Quarter Recap

  • Revenue: $9.62 B (+12.6 % YoY)
  • Operating Margin: 23.6 % (up 1.1 pts)
  • Net Income: $1.94 B (+15 %)
  • EPS: $4.25 (+14 %)
  • Free Cash Flow: $1.7 B (slightly lower on $18 B content spend)
  • Paid Memberships: 282 M (+9 %)
  • Ad-tier Share: ≈ 16 % of new sign-ups (vs 9 % in Q2)
  • Regional Growth: APAC +22 %, LATAM +18 %, EMEA +10 %, UCAN +8 %

Key Highlights and Management Comments

Greg Peters (Co-CEO):

“Our ad-supported plan is scaling faster than expected. We’re now live in 15 markets, and we expect this to be a multi-billion-dollar business by 2026.”

Spencer Neumann (CFO):

“We’re on track for roughly $7 billion in free cash flow this year, even after increasing content investment to $18 billion.”

Ted Sarandos (Co-CEO):

“AI is improving localization, dubbing, and recommendations — helping creators reach global audiences, not replacing them.”


SWOT Analysis

Before breaking down Netflix’s quarter into strengths, weaknesses, opportunities, and threats, it’s useful to step back and look at what really moved the numbers this time. Q3 2025 wasn’t a story about subscriber growth or content costs alone — it was about a business transitioning into a more diversified, margin-focused platform. The sudden tax hit added noise, but underneath, Netflix is shaping a clearer long-term trajectory.
The SWOT framework highlights how each of these forces may translate into real price impact for investors.

Strengths

  • Ad-tier scaling ahead of plan (+8 – 12 %)
  • Operating margin expanding (+4 – 6 %)
  • Solid subscriber growth (+3 – 5 %)

Weaknesses

  • Heavy content spend pressures FCF (–3 – 5 %)
  • UCAN saturation limits pricing (–2 – 3 %)

Opportunities

  • Global ad expansion (15 markets, 16 % of sign-ups) (+10 – 15 %)
  • AI-powered localization & discovery (+4 – 6 %)
  • Gaming and live content diversification (+2 – 3 %)

Threats

  • Brazil tax dispute (–6 – 8 %)
  • Streaming competition (–4 – 6 %)
  • FX headwinds in LATAM (–2 – 3 %)

Net Impact: ≈ +1.5 – 2 % upside vs current price.


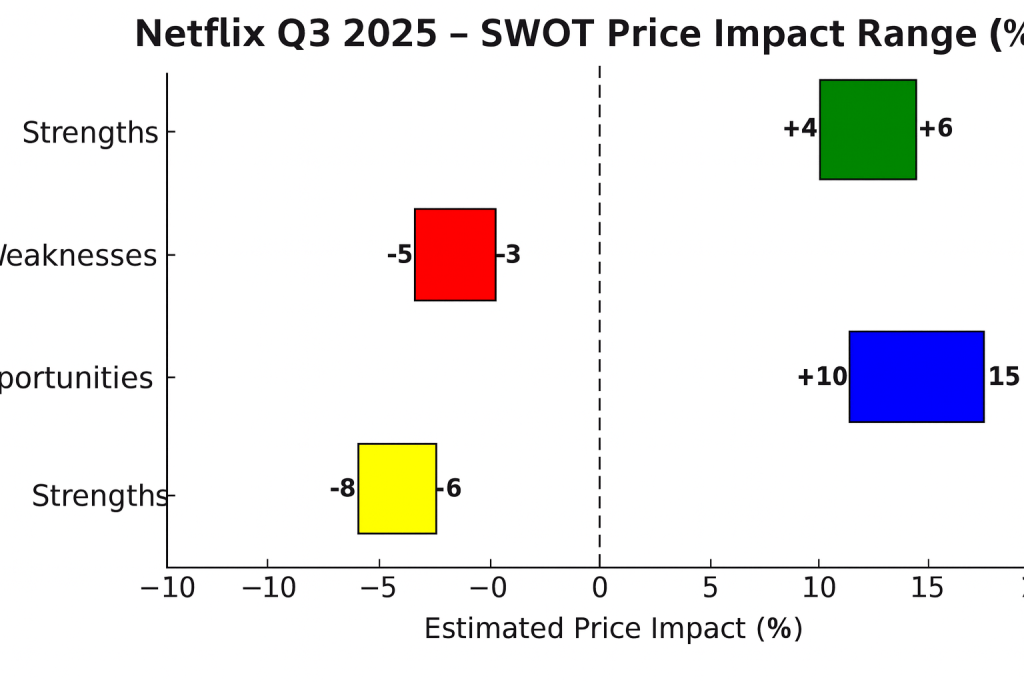
SWOT Price Impact Chart for Netflix Q3 2025 showing estimated price impact ranges for each SWOT factor.


Valuation Scenarios (Q4 2025 – Mid 2026 Horizon)

With the SWOT picture in place, the next step is understanding how these drivers translate into valuation. Netflix is no longer purely a high-growth streaming play; it’s a hybrid model balancing global expansion, ad monetization, and AI-driven efficiency. Each scenario—bull, base, and bear—reflects a different path the company could take depending on execution, competitive pressure, and regulatory risks.
The following valuation scenarios show how those paths map to price targets and a probability-weighted fair value.

Bull Case (35 %)

  • Ad-tier accelerates; margin 25 % +; EPS >$6 → Target $1,450 (+17 %)

Base Case (45 %)

  • Stable 7 % subscriber growth; margin 24 % → Target $1,250 (+1 %)

Bear Case (20 %)

  • Tax drag repeats; churn rises; cost inflation → Target $1,000 (–19 %)

Fair Value: Weighted Average ≈ $1,270
Current Price: ≈ $1,240 → +2.4 % Upside

Valuation scenarios chart for Netflix Q3 2025 showing three vertical bars: Bear case ($1,000 at 20%, red), Base case ($1,250 at 45%, gray), and Bull case ($1,450 at 35%, green). A dashed horizontal line marks the fair value at $1,270, following the same format as the Palo Alto Networks valuation chart.

Valuation Scenarios Chart for Netflix Q3 2025 displaying Bear, Base, and Bull targets with a fair-value line at $1,270.


Verdict

Netflix is shifting from a subscriber-growth story to a profit-platform narrative.
The 6 % post-earnings drop looks more like a valuation reset than a fundamental issue.
If the Brazil tax charge proves one-off, Q3 2025 may mark the start of a more sustainable, AI-enhanced growth chapter.

Short-term: Hold / Accumulate on weakness
Medium-term: Attractive for growth investors eyeing AI and ad-tier upside


Call to Action

👉 Follow SWOTstock for AI-driven SWOT analyses of top global companies.
📈 Stay ahead of the market with data-driven insights simplified for retail investors.


Disclaimer

This analysis is based solely on Netflix’s official Q3 2025 financial statements and earnings call materials. It is for educational and informational purposes only and does not constitute investment advice.

Palo Alto Networks Q1 FY2026 — “Steady Growth, Strong ARR, and a Market That Wanted More”

Palo Alto Networks reported strong FY2026 Q1 results, with a 16% revenue increase to $2.50 billion and a 29% rise in NGS ARR to $5.9

TL;DR Summary

Palo Alto Networks delivered a solid first quarter for FY2026: revenue climbed 16% to $2.50 billion, NGS ARR rose 29% to $5.9 billion, and RPO expanded 24% to $15.5 billion. Non-GAAP EPS of $0.93 beat expectations, reaffirming the company’s execution as customers expand platform adoption across Strata, Prisma, and Cortex. Yet shares traded lower after earnings as full-year guidance held steady, signaling a “good but not great” quarter for a stock priced for upside surprises. Our probability-weighted fair value comes in at $211, modestly above today’s ~$200 level.


Quarter Recap

Palo Alto Networks opened fiscal 2026 with steady momentum across its recurring revenue engines. Revenue grew 16% year-on-year to $2.50 billion, reflecting consistent demand for platformized security solutions. Next-Generation Security ARR expanded 29% to $5.9 billion, and the company’s Remaining Performance Obligation reached $15.5 billion, illustrating multi-year visibility as customers commit to broader and longer-term contracts. Non-GAAP EPS of $0.93 came in ahead of expectations, supported by robust software mix and continued traction in large deals. GAAP net income softened to $334 million due to higher operating investments and recent acquisition activity. Full-year guidance was reaffirmed at 14% revenue growth and 38–39% free cash flow margin, indicating stable execution without major revisions.


Key Highlights

  • Revenue grew 16% YoY to $2.50B
  • NGS ARR increased 29% YoY to $5.9B
  • RPO reached $15.5B, up 24% YoY
  • GAAP net income: $334M
  • Non-GAAP EPS: $0.93
  • FY2026 revenue guide: $10.50B–$10.54B (~14% YoY)
  • FY2026 non-GAAP EPS guide: $3.80–$3.90
  • FY2026 FCF margin: 38–39%
  • Strong platform adoption across Strata, Prisma, Cortex
  • Deal cycles remain healthy with large multi-module wins

SWOT Analysis

Strengths (+6% to +12%)

Palo Alto’s platform strategy continues to resonate, with customers consolidating disparate tools into unified architectures across network, cloud, and SOC operations. Robust ARR and RPO growth demonstrate durable demand and expanding wallet share. Execution remains consistent, with non-GAAP EPS beating expectations and free cash flow margins reaffirmed at attractive levels.

Weaknesses (–5% to –10%)

GAAP profitability remains pressured as the company absorbs integration costs and continues its investment cycle. The flat full-year revenue outlook reflects strong but not accelerating momentum, which limits near-term operating leverage. Competition and elevated valuation require continuous outperformance to sustain premium multiples.

Opportunities (+8% to +15%)

AI-aligned security represents a significant long-term catalyst. Enterprises are rearchitecting systems to protect AI workloads, model governance, and data pipelines — opening the door for larger platform deals. If AI-driven security cycles broaden or ARR momentum accelerates, Palo Alto could benefit from expanding deal sizes and higher-margin software adoption.

Threats (–8% to –15%)

The competitive landscape remains intense, with CrowdStrike, Zscaler, Fortinet, and hyperscalers rolling out AI-native security features. Deal timing remains sensitive to macro conditions, and any slowdown in billings or ARR conversion could weigh on sentiment. With valuation elevated, even modest disappointments can trigger multiple compression.


SWOT Table

Strengths
+6% to +12%
Execution strength, ARR growth, platform adoption

Weaknesses
–5% to –10%
GAAP margin pressure, flat guide, integration costs

Opportunities
+8% to +15%
AI-security demand, larger platform deals, multi-year contracts

Threats
–8% to –15%
Intense competition, valuation risk, deal-cycle volatility

SWOT price impact chart for Palo Alto Networks Q1 FY2026 showing strengths, weaknesses, opportunities, and threats with corresponding dollar impact ranges on a horizontal bar graph.

Valuation Scenarios & Fair Value

Bull Case — $253 (35% probability)

Assumes stronger ARR expansion, AI-security deal momentum, and upside to FY26 revenue.
EPS: $3.95
Multiple: 64×
Target: $253

Base Case — $200 (50% probability)

Represents steady execution consistent with FY26 guidance.
EPS: $3.85
Multiple: 52×
Target: $200

Bear Case — $152 (15% probability)

Reflects slower deal cycles or competitive pressure leading to multiple compression.
EPS: $3.80
Multiple: 40×
Target: $152

Probability-Weighted Fair Value

0.35(253)+0.50(200)+0.15(152)=2110.35(253)+0.50(200)+0.15(152)=211

➡️ Fair Value Estimate: $211 per share

Today’s price near ~$200 suggests modest upside.

Valuation scenarios chart for Palo Alto Networks Q1 FY2026 showing bear case target of $152, base case target of $200, and bull case target of $253, with a dashed line indicating fair value at $211.”

Verdict

Palo Alto delivered a confident and well-executed quarter with strong ARR performance and healthy deal momentum. The reaffirmed full-year outlook signals stability, but the market was looking for acceleration, especially given the AI-security narrative. For long-term growth investors, the fundamentals remain compelling: resilient demand, high software mix, and strong free cash flow. With shares trading slightly below our $211 fair-value estimate, Palo Alto represents a reasonable entry point for exposure to platformized, AI-aligned cybersecurity — though upside may rely on renewed momentum in billings or a more aggressive guidance raise later in FY2026.


Call to Action

If you found this breakdown helpful, follow SWOTstock for more AI-driven fundamental analysis on today’s most important tech and cybersecurity companies. Each report is built from official filings, earnings transcripts, and a structured methodology designed for disciplined investors.


Disclaimer

This article is for informational purposes only and is not investment advice. All analysis is based exclusively on Palo Alto Networks’ official earnings report, financial disclosures, and management commentary from the latest quarter. Investors should perform their own research or consult a financial professional before making investment decisions.


Why Goldman Is Backing Baidu: AI Cloud Momentum Meets Policy Tailwinds

Baidu is experiencing substantial growth in its AI cloud services, with a 42% increase despite a 6% decline in advertising revenue, leading to decreased earnings. Goldman Sachs maintains a Buy rating, citing strategic investments. However, risks include U.S. chip restrictions and regulatory changes. Baidu’s valuation suggests potential upside if AI monetization improves.

TL;DR: Baidu’s AI Cloud Is Booming, But Ad Weakness Lingers

Goldman Sachs reaffirmed its Buy rating on Baidu despite trimming its price target. Beneath the drag of declining ad revenue lies a fast-growing AI cloud engine and deep integration into China’s AI strategy. In Q1 2025, Baidu’s cloud grew over 40%, outpacing peers like Alibaba and Tencent. While earnings dipped, strategic investments in ERNIE AI and Apollo Go are gaining traction. At ~$84, Baidu trades at a 20–25% discount to its estimated fair value.

Clean infographic summarizing Baidu’s Q1 2025: +42% AI Cloud growth, –6% ad revenue decline, investments in Ernie AI and Apollo Go, and a 20–25% valuation discount, with no footer text.

Quick Risk Snapshot

Top 3 Risks at a Glance

  • Export Controls: U.S. chip curbs may limit Baidu’s model training capabilities
  • Regulatory Crackdown: Surprise data or AI rules in China could cut valuations overnight
  • Monetization Gap: ERNIE is technically impressive—but where’s the revenue?

Q1 2025 Recap: AI is Surging, but Ads Still Weigh on Profitability

Baidu delivered a mixed but forward-looking quarter. Revenue rose 3% YoY to ¥32.45 billion, beating expectations, driven by a 42% jump in AI Cloud services. However, its core advertising revenue declined 6%, pulling EPS down by 7%.

Management emphasized that Baidu is no longer just an ad business. CFO Junjie He called AI Cloud a “structural growth engine,” with new pricing strategies designed to build market share quickly.

Why it matters: This quarter signals that Baidu is chasing scale and infrastructure leadership—not just short-term margins.

Bar chart comparing Baidu’s Q1 2025 segment revenue: AI Cloud at ¥9.4B and Ad Revenue at ¥16.0B, highlighting the company’s growing cloud business versus its declining ad segment.

Key Highlights

  • Revenue: ¥32.45B (+3% YoY)
  • Adjusted EPS: ¥18.54 (–7% YoY)
  • AI Cloud: ¥9.4B (+42% YoY)
  • Ad Revenue: ¥16.0B (–6%)
  • ERNIE AI: Free-tier and Turbo upgrades launched
  • Apollo Go: Overseas ops launched in UAE and Switzerland
  • Buybacks: $445M in Q1; $2.1B total
  • Ratings: Goldman, Benchmark maintain Buy
Line chart comparing Baidu’s revenue and net income over the last five quarters (Q1 2024 to Q1 2025), showing consistent revenue near ¥32–34B and rising net income peaking at ¥7.72B in Q1 2025.

SWOT Analysis: A High-Potential Pivot With Limited Room for Error

Let’s break it down using the SWOT framework—what’s working, what’s not, where upside lies, and what could derail the story.

Strengths

  • AI Cloud Outperformance: 42% growth beats Alibaba (+18%) and Tencent (+5%)—suggests Baidu’s architecture is gaining real-world adoption.
  • ERNIE Model Pipeline: Free, open-access models with advanced reasoning (X1) and multimodal capability (4.5) aim to build developer lock-in.
  • Backed by Big Names: Goldman and Benchmark keeping Buy ratings provides institutional cover.

+ Price Impact: +$15 to +30

Weaknesses

  • Ad Revenue Shrinkage: 6% drop in core advertising weakens cash flow reliability.
  • Earnings Pressure: Margin compression from free tools, price cuts, and rising AI compute costs.
  • Transparency: Baidu’s upbeat tone feels disconnected from profitability trends—investors may question reporting quality.

– Price Impact: –$10 to –20

Opportunities

  • China AI Policy Tailwinds: Backed by a ¥60B national AI fund, Baidu is well-positioned as a state-aligned infrastructure play.
  • Apollo Go Global: Early mover in robotaxis beyond China borders—may attract sovereign or enterprise partnerships.
  • AI Monetization Path: If Baidu can convert ERNIE from R&D to revenue via enterprise tools or cloud inference APIs, re-rating likely.

+ Price Impact: +$10 to +25

Threats

  • Tech Export Curbs: U.S. chip bans on Nvidia/AMD AI hardware limit model training capacity.
  • Rising Domestic Competition: Alibaba’s Tongyi Qianwen and Tencent’s Hunyuan are growing fast with commercial APIs.
  • Delisting/Regulatory Risk: ADR structure, CCP data controls, or surprise regulation could drastically change valuation environment.
  • Currency Volatility: RMB depreciation adds an FX layer to Baidu’s dollar-denominated shares.

– Price Impact: –$15 to –30

Factor Range Impact Notes
Strengths +15 to +30 Cloud & ERNIE momentum
Weaknesses –10 to –20 Ad reliance, earnings fade
Opportunities +10 to +25 Policy & mobility tailwinds
Threats –15 to –30 Geopolitical and regulatory

Implied Range: $69 – $114 vs current price ~$84

Horizontal SWOT chart showing Baidu’s Q1 2025 stock price impact estimates, with fixed x-axis from –40 to +40: Threats (–30 to –15), Opportunities (+10 to +25), Weaknesses (–20 to –10), Strengths (+15 to +30), and a vertical dashed baseline at $0.

Valuation Scenarios: How It Could Play Out

Valuation = EPS forward ​× P/E

Base Case – 7.00 × 15 = $105

Cloud keeps scaling, ads stabilize
Probability: 60%

Bull Case – 7.75 × 18 = $140

Enterprise AI lands, Apollo Go JV, margin gains
Probability: 25%

Bear Case – 5.00 × 15 = $75

AI stalls, chip blocks hit hard, new China policy drop
Probability: 15%

Weighted Average Estimate: $106.25 → +26% upside

(105×0.6)+(140×0.25)+(75×0.15)=106.25

Chart comparing Baidu’s Q1 2025 valuation scenarios: Bear Case ($75), Base Case ($105), Bull Case ($140), alongside current price ($84) and a dotted fair value line at $106.25.

Verdict: Cautiously Optimistic, AI-Led Rerating Is Possible

Baidu’s execution is improving, even as its earnings lag. AI Cloud is clearly working. ERNIE shows potential. Apollo Go is going international. Still, transparency, monetization, and policy remain wildcards.

If you believe China is serious about tech independence, Baidu is its AI bet. The risk/reward is no longer binary—but still asymmetric.

Our Take: Slightly undervalued. Buy/accumulate with a long-term AI view.


What Would Change Our View?

Upside Triggers

  • AI monetization evidence (cloud APIs, enterprise adoption)
  • Positive shift in U.S.-China chip policy
  • Robotaxi revenue in H2

Downside Red Flags

  • Surprise AI regulation in China
  • Margin compression without revenue pickup
  • Negative audit news or delisting pressure

Call to Action

Want more AI-powered investment breakdowns—without the hype? Follow @SWOTstock and get the next big move before the headlines hit.


Disclaimer

This post is based solely on Baidu’s official financial report, earnings call, and verified analyst commentary. It is not investment advice. Please do your own research.


Leave a comment