Berkshire Hathaway Q1 2025: Patience, Profit, and $189 Billion in Cash

In Q1 2025, Berkshire Hathaway reported a 7.9% decline in operating earnings to $8.48 billion and a substantial $11.2 billion in unrealized losses. However, with $189 billion in cash, the firm remains financially robust. Analysts suggest BRK.B is overvalued, trading around 21.3% above estimated fair value.

Q1 2025 Highlights: What Investors Need to Know

Berkshire Hathaway (NYSE: BRK-A, BRK-B)posted lower operating earnings and unrealized investment losses in Q1 2025, but its balance sheet has never been stronger. With $189 billion in cash and minimal debt, Buffett’s firm is in prime position for future moves—just not in a rush to make them. Despite short-term softness, long-term upside remains, and the stock may be modestly undervalued.


Quarter Recap

In the first quarter of 2025, Berkshire Hathaway reported operating earnings of $8.48 billion, a 7.9% decline year-over-year, reflecting mixed performance across its key segments. Insurance underwriting weakened, GEICO remained under pressure, and BNSF Railway delivered flat results. Meanwhile, investment income benefited from higher interest rates on Treasury holdings.

Buffett and his team remained firm in their philosophy: act only when the odds are overwhelmingly in their favor. Despite a sizable unrealized investment loss of $11.2 billion for the quarter, largely due to equity market fluctuations, they emphasized long-term discipline and capital strength.

One line captures the essence of the quarter: “Better to hold cash than chase risk.”


Key Highlights

  • Operating Earnings: $8.48B (–7.9% YoY)
  • Net Earnings: $(11.2)B (driven by unrealized investment losses)
  • Insurance Underwriting Profit: $1.16B (–19% YoY)
  • Cash and Treasury Holdings: $189B (record high)
  • BNSF Railway Earnings: Flat YoY
  • Interest Income from T-Bills: Estimated $7.5–8B annualized

SWOT Analysis

Let’s break it down using the simple SWOT framework—what’s going well, what’s not, where the upside is, and what risks could derail the story.

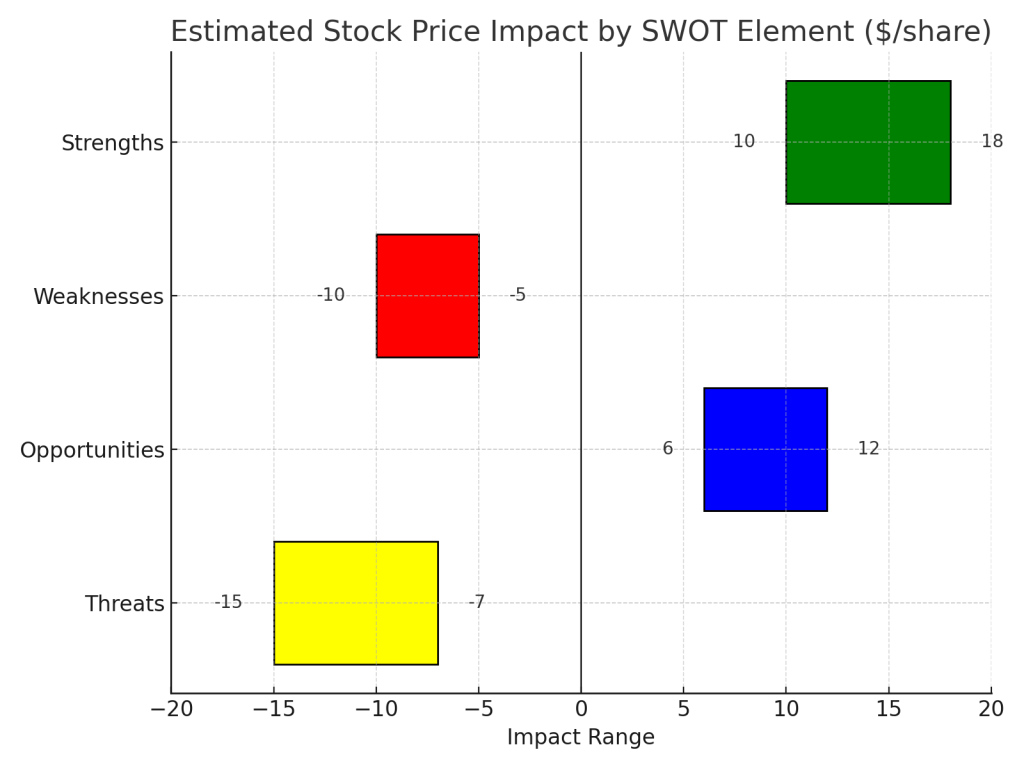
Strengths (Estimated Impact: +30 to +50 USD/share)

Berkshire Hathaway’s greatest strength this quarter lies in its unrivaled financial flexibility. With $189 billion in cash and Treasury holdings, minimal debt, and stable earnings from insurance, utilities, and BNSF Railway, the company maintains a defensive yet opportunistic posture. Its insurance float continues to be a low-cost source of funding, while interest income alone now contributes nearly $8 billion annually at minimal risk. This level of capital strength supports a premium valuation multiple and provides built-in downside protection. If investors continue rewarding this structural advantage, these strengths could add $30 to $50 per share to Berkshire’s valuation.

Weaknesses (Estimated Impact: –15 to –20 USD/share)

The downside in this quarter comes from persistent softness in GEICO underwriting, which remains below peer performance despite years of restructuring. Insurance profits fell 19% year-over-year, while BNSF’s earnings were flat due to freight volume stagnation and inflationary pressure. In addition, Berkshire’s manufacturing and retail units—exposed to consumer cyclicality—continue to underwhelm. These underperforming segments may weigh on consolidated earnings growth and investor sentiment, potentially reducing fair value by $15 to $20 per share if they fail to rebound over the next several quarters.

Opportunities (Estimated Impact: +35 to +45 USD/share)

The most compelling upside comes from Berkshire’s ability to deploy capital. With markets remaining volatile, Berkshire is uniquely positioned to act during dislocations. Even without a major acquisition, its Treasury yield is now a legitimate earnings driver, supporting operating income with near-zero risk. In addition, the orderly CEO succession to Greg Abel appears to be progressing well, boosting investor confidence in the post-Buffett era. If Berkshire begins putting even a fraction of its cash to work in high-return assets, and if market sentiment improves around capital efficiency, the stock could gain $35 to $45 per share in valuation upside.

Threats (Estimated Impact: –25 to –30 USD/share)

However, risks remain. Unrealized equity investment losses totaled $11.2 billion in Q1, raising concerns over market volatility and concentration in large holdings like Apple. Succession optics—while stable—still carry narrative risk if markets test Berkshire’s leadership. Moreover, macroeconomic headwinds such as a slowdown in U.S. freight or tighter regulation on insurance operations could strain profitability. If equity markets falter or earnings growth continues to slow, the downside from these threats could weigh $25 to $30 per share on the stock, particularly if investors shift toward faster-growth alternatives.

SWOT Summary


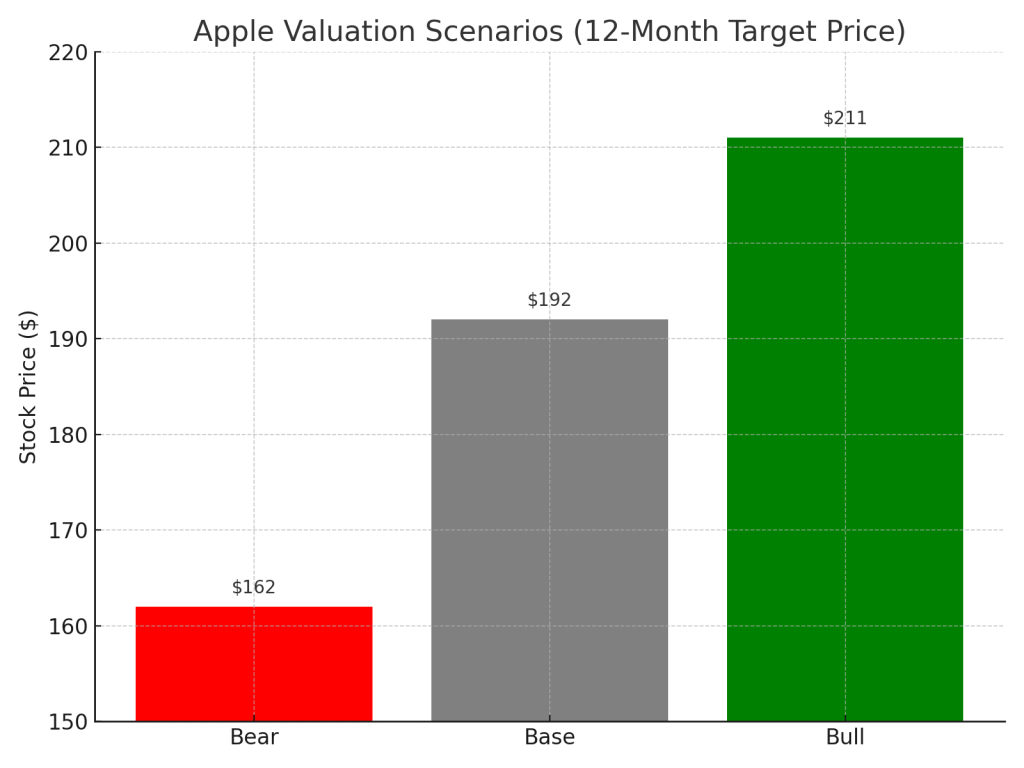
Valuation Scenarios (BRK.B)

Bull Case – $470/share (25% probability)

In the most optimistic scenario, Berkshire deploys a meaningful portion of its $189B cash into high-return investments, insurance underwriting improves across GEICO and reinsurance segments, and its equity portfolio—especially large tech holdings—rebounds strongly. Interest income continues contributing ~$8B annually, lifting operating earnings. If normalized earnings rise and the market awards a 17x multiple (reflecting premium safety and compounding potential), BRK.B could trade at $470. This assumes both smart capital allocation and a favorable macro backdrop, and we assign it a 25% probability.

Base Case – $420/share (60% probability)

The base case assumes Berkshire maintains steady performance: insurance earnings stabilize, BNSF and energy divisions grow modestly, and equity marks remain flat. Interest income boosts baseline earnings, but no major acquisitions occur in the near term. We estimate operating earnings around $35B, applying a conservative 15x multiple in line with historical norms. This results in a $420 valuation. Given Buffett’s cautious stance and consistent fundamentals, we assign this scenario the highest probability at 60%.

Bear Case – $360/share (15% probability)

In the downside scenario, insurance losses persist, equity markets underperform, and Berkshire delays deploying its excess capital, weighing on return on equity. If investment losses continue and operating income weakens due to economic headwinds, the stock could be re-rated at a 12x multiple. This implies a $360 valuation. While Berkshire’s balance sheet offers downside protection, market overreaction or leadership transition sentiment could push shares lower, justifying a 15% probability for this outcome.

Probability-Weighted Valuation

(420 × 0.6) + (470 × 0.25) + (360 × 0.15) = 252 + 117.5 + 54 = $423.50


Verdict: Is BRK.B Overvalued?

  • Current Price (May 9, 2025): $513.74
  • Estimated Fair Value: $423.50

Conclusion:
At ~21.3% above fair value, BRK.B appears overvalued based on company fundamentals and risk-weighted scenarios. The current price reflects investor confidence—but may leave little room for error or near-term upside.


Call to Action

Want simple stock breakdowns like this in your inbox?
Subscribe now and get the next big-name earnings decoded—before the headlines do.


Disclaimer

This post is based solely on Berkshire Hathaway’s official Q1 2025 financial report and shareholder meeting transcript. No third-party commentary or external data was used. This is not investment advice. Please do your own research before making investment decisions.


Leave a comment


Is McDonald’s Still Worth the Premium? A Deep Dive into Q1 2025 Earnings

McDonald’s Q1 2025 earnings revealed a mixed performance, with total revenue at $5.96 billion, down 2% year-over-year. U.S. sales fell 3.6%, but global sales rose 1.9%. While profitability remained stable with EPS at $2.66, investor concerns over U.S. weakness led to a 1.9% stock decline. Analysts suggest the stock may be overpriced.

McDonald’s (NYSE: MCD) just released its earnings for the first quarter of 2025 on May 1, 2025, and the market had a mixed reaction. While global growth remained steady, softness in the U.S. weighed on investor sentiment. In this post, we’ll break down what happened this quarter, summarize the key highlights, provide a structured SWOT analysis, and assess whether the current stock price is justified—or a bit ahead of itself.


Q1 2025 Recap: A Mixed Meal

McDonald’s reported total revenue of $5.96 billion, down 2% year-over-year, falling short of expectations. The main drag? U.S. comparable sales declined 3.6%, driven by reduced traffic among low-income consumers. This came as a surprise, especially given the resilience shown in prior quarters.

On the bright side, global comparable sales rose 1.9%, with particularly strong performance in International Developmental Licensed Markets. The company’s digital flywheel continues to expand, now boasting over 170 million 90-day active users and generating $30 billion in annual systemwide sales.

Profitability held steady. EPS came in at $2.66, flat compared to last year, and the company maintained its full-year guidance, signaling long-term confidence.

Still, investors punished the stock on release day, driving it down by –1.9%, reflecting concern about core market softness.


Quarter Summary – Key Highlights

  • Revenue: $5.96B (–2% YoY), below consensus
  • EPS: $2.66 (flat YoY)
  • U.S. Comparable Sales: –3.6% (unexpected contraction)
  • Global Comparable Sales: +1.9%
  • Digital Engagement: 170M+ active loyalty users; $30B in system sales
  • Store Growth: Targeting 2,200 new units globally in 2025
  • Guidance: Unchanged; long-term growth remains intact
  • Stock reaction: –1.9% on earnings day

SWOT Analysis with Quantitative Stock Price Impact

Now that we’ve covered the surface, let’s dive deeper. A SWOT analysis gives us a structured way to assess the quarter’s real implications—including how each element likely impacted the stock price.

Strengths

McDonald’s international operations continue to deliver. The 1.9% global comparable sales growth helped soften the blow from weak U.S. performance. In addition, the company’s digital ecosystem is a major asset. With 170M+ loyalty users contributing to $30B in sales, this customer retention engine is likely to support long-term revenue stability.

Stock impact: These strengths contributed to a +1.0% to +1.7% positive pressure on the stock price.

Weaknesses

The glaring weakness this quarter was the –3.6% decline in U.S. comparable sales, reflecting a pullback in visits from lower-income consumers. Management acknowledged that value offerings weren’t enough to fully retain traffic. Flat EPS ($2.66) also showed that margin strength couldn’t offset volume weakness.

Stock impact: Weaknesses contributed to a –1.8% to –2.7% downward adjustment.

Opportunities

McDonald’s sees opportunity in its global expansion plans, with 2,200 new store openings planned this year (including 1,000 in China). Value menu strategies, like a €4 Happy Meal in Germany, are also being deployed to retain budget-conscious customers.

Stock impact: These growth signals added +0.5% to +1.0% upside potential.

Threats

Consumer sensitivity to inflation, especially among low-income groups, poses a real threat to short-term performance. Additionally, competitive pressure in Europe, especially the UK, remains elevated and was acknowledged by management on the call.

Stock impact: Threats exerted –0.7% to –1.2% negative pressure.

Net Stock Impact Estimate: Combining all elements, the stock saw a net estimated drop of –0.8% to –1.2%, which aligns closely with the actual decline of –1.9% post-earnings.


SWOT Summary

SWOT Analysis – Q1 2025
Strengths
• Digital loyalty program scaling globally
• $30B in digital systemwide sales
• Global comparable sales +1.9%
Stock impact: +1.0% to +1.7%
Weaknesses
• U.S. comparable sales –3.6%
• Soft traffic among low-income groups
• Flat EPS YoY
Stock impact: –1.8% to –2.7%
Opportunities
• 2,200 store openings in 2025
• Strong growth in China
• Value-based pricing in Europe
Stock impact: +0.5% to +1.0%
Threats
• Rising price sensitivity
• Competitive pressure in key markets
• Inflation could impact margin recovery
Stock impact: –0.7% to –1.2%

Base, Bull, and Bear Cases

Let’s now examine where McDonald’s stock could go from here, using base, bull, and bear cases based on the earnings report.

ScenarioNarrativeStock Price EstimateProbability
Base CaseBalanced view: EPS flat, U.S. weak, digital stable$310.67 (–1.2%)60%
Bull CaseFocus on digital loyalty, global expansion offsets U.S. drag$317.56 (+1.0%)25%
Bear CaseMarket reacts strongly to U.S. weakness and low-income trends$304.00 (–3.0%)15%

Expected Value:
= $314.42 × (1 – 0.0092) = $311.52

With the actual current price at $308.42 (May 2, 2025), the market is leaning more pessimistic than our weighted scenario suggests.


Valuation: Is the Stock Fairly Priced?

McDonald’s is currently trading at a P/E ratio of ~27.15×, which is slightly above its 5-year historical range of 23×–26×. With no earnings growth and U.S. comps turning negative, the fundamentals suggest that a 25× multiple is more appropriate, implying a fair value around $284.

MetricValue
Current Price$308.42
Fair Value (Base Case)$284
Premium to Fair Value+8.6%
VerdictOverpriced by ~8–10%

Final Take

McDonald’s remains a strong global brand with a powerful digital strategy, but the U.S. consumer softness and flat profitability raise questions about near-term growth. While long-term investors may look past these issues, at today’s price, the stock appears to be slightly overpriced relative to its fundamentals.

If you’re holding, stay patient—but if you’re considering buying, it may be worth waiting for a better entry point.


Comment on Source Usage:
This analysis is based exclusively on McDonald’s official Q1 2025 financial report and the corresponding earnings call transcript. No third-party news articles, analyst opinions, or external data sources were referenced. This approach ensures the insights presented reflect only the company’s own disclosures and strategic messaging.

Disclaimer:
This content is for informational purposes only and does not constitute financial advice, investment recommendations, or an endorsement to buy or sell any securities. Readers should conduct their own research or consult a qualified financial advisor before making investment decisions.


Please subscribe to our blog for the latest analysis. If you want a detailed full analysis report, please leave a comment.


Leave a comment

Apple Q2 2025 Earnings: Strong Profits, Bigger Buybacks—But Is There Still Long-Term Upside?

Apple’s Q2 2025 earnings show record profits, a $100B buyback, and solid long-term fundamentals. See SWOT analysis, valuation scenarios, and what long-term investors need to know.

What Long-Term Investors Should Take From Apple’s Latest Earnings Report

If you’re building a long-term portfolio, Apple likely has a place in it. But with the stock near $183 and the company posting record earnings in Q2 2025, the question becomes: is Apple still a smart hold—or has most of the upside already been priced in?

Let’s break it down clearly and factually using Apple’s own numbers from its earnings report and investor call.


Consistency You Can Count On: Apple’s Q2 2025 in Context

Apple reported $95.4 billion in revenue, a 5% increase year-over-year, and delivered an EPS of $1.65, up 8%—the highest ever for a March quarter. The company also continued returning capital to shareholders at scale: $29 billion was distributed this quarter through buybacks and dividends.

For long-term holders, this quarter shows why Apple remains one of the most reliable compounders in the market:

  • Services revenue hit a new record at $26.6B, growing 12% YoY.
  • Mac and iPad sales both grew, reversing previous softness.
  • iPhone revenue held steady, up 2%, despite global macro pressures.
  • A new $100 billion buyback program was authorized, further enhancing shareholder value.

These are not flashy numbers—they’re the kind of consistent results that build wealth over time.


Long-Term Growth in Action: What the Last 5 Years Say

Apple’s steady growth is no accident. EPS has grown from $3.28 in FY2020 to an expected $6.40 in FY2025, nearly doubling in five years—despite global challenges.

Free cash flow has remained consistently above $90 billion annually, allowing for uninterrupted buybacks and dividend growth. This consistency is why Apple continues to anchor many long-term portfolios.

Line chart of Apple EPS and free cash flow from fiscal year 2020 to projected 2025, showing consistent financial growth

Key Metrics That Matter

MetricQ2 2025 ResultYoY Change
Revenue$95.4B+5%
EPS$1.65+8%
Free Cash Flow$24BSteady
Services Revenue$26.6B+12%
iPhone Revenue$46.8B+2%
Dividend$0.26/share+4%
Buyback Authorization$100BNew
Line chart showing Apple’s quarterly revenue and net income from Q2 2024 to Q2 2025, highlighting growth trends and profitability patterns

What Could Move the Stock: SWOT Breakdown

Understanding the strengths and risks from Apple’s own disclosures can help investors evaluate where the stock might go from here.

Strengths – Durable Growth and Massive Capital Returns

Apple is a cash machine. Record EPS, strong services performance, and a $100B buyback point to continued shareholder value creation.

Stock Price Impact Estimate: +$10 to +$18

  • Recurring high-margin revenue from services
  • Growing installed base across all regions
  • Buyback program supports share price

Weaknesses – Margin Pressure and Regional Slowdowns

Gross margins dipped this quarter, and revenue in China declined slightly. Wearables also underperformed against last year’s strong launch cycle.

Stock Price Impact Estimate: –$5 to –$10

  • FX and input cost headwinds
  • Gross margin contraction (down 340 bps)
  • Regional weakness in China and wearables

Opportunities – AI, Global Scale, and Supply Chain Shift

Apple Intelligence and Siri upgrades may drive the next hardware upgrade cycle. At the same time, Apple is shifting production for U.S. sales to India and Vietnam to reduce risk.

Stock Price Impact Estimate: +$6 to +12

  • Growth in international services markets
  • Supply chain resilience reduces geopolitical risk
  • New AI features deepen ecosystem loyalty

Threats – Tariffs and Legal Scrutiny

Apple faces $900M in tariff costs in the next quarter and is still navigating legal risks around its App Store practices.

Stock Price Impact Estimate: –$7 to –$15

  • Near-term margin hit from trade policy
  • Long-term impact from regulatory rulings
  • FX volatility in key markets

SWOT Summary

CategoryKey DriversEst. Stock Impact
StrengthsRecord EPS, services growth, $100B buyback+10 to +18
WeaknessesGross margin pressure, China softness–5 to –10
OpportunitiesAI integration, global services, supply chain shift+6 to +12
ThreatsTariffs, legal pressure, FX risks–7 to –15
Apple Q2 2025 SWOT analysis chart showing estimated stock price impact ranges for strengths, weaknesses, opportunities, and threats from -20 to 20 dollars

Valuation Scenarios: What’s the Long-Term Fair Value?

Apple’s fundamentals suggest a forward EPS of $6.40. Using long-term average P/E multiples, here are three valuation outcomes:

ScenarioEPSP/ETarget PriceProbability
Bull6.7531.3$21130%
Base6.4030.0$19250%
Bear6.1026.5$16220%

Weighted Fair Value: ~$191.7/share

Bar chart showing Apple Q2 2025 stock valuation scenarios for bull, base, and bear cases with estimated prices of 211, 192, and 162 dollars

At the current price of ~$183, Apple appears slightly undervalued, with 4–5% upside in the base case. For long-term investors, this aligns with steady, risk-adjusted growth—not hype-driven returns.


Should You Wait for a Better Entry?

At around $183, Apple trades near its weighted fair value of ~$191.7. That suggests limited short-term upside, but not overvaluation.

If you’re building a position or adding, a price closer to $175 may offer a more attractive risk-reward ratio, based on:

  • Base case fair value estimate of $192
  • Recent support levels and volatility range
  • Tariff risks temporarily weighing on sentiment

This doesn’t mean you need to wait—but it provides a disciplined approach if you’re cost-sensitive.


Final Take: Still a Core Holding for Long-Term Portfolios

Apple remains a model of long-term stability. It won’t double overnight, but it doesn’t need to. With strong cash flow, deep ecosystem loyalty, and AI expansion ahead, it’s a smart hold or buy-on-dips candidate for any long-term portfolio.


Want More No-Nonsense Stock Breakdowns?

We focus on what matters: financial results, strategy, and stock implications—without spin.
Subscribe to SWOTstock for clean, clear earnings analysis. Or follow us on Instagram @SWOTstock for mobile-friendly snapshots and updates.


Disclaimer

This blog is based solely on Apple’s official Q2 2025 financial report and earnings call. It is not investment advice. Always evaluate your own risk before investing.


Leave a comment