TL;DR Summary
Dell delivered a mixed but stable Q3 FY2025 as AI servers continued to surge while the PC business remained weak. Revenue came in slightly light, yet strong ISG momentum and solid free cash flow pushed the stock from $125.92 to roughly $130 after hours. Management guided to better margins in Q4, reinforcing the view that Dell is entering a more stable phase as AI infrastructure demand grows. Our fair value estimate stands at $135, with upside tied to ISG mix improvement and the 2026 AI PC refresh cycle.
Quarter Recap
Dell reported Q3 FY2025 results on November 25, 2025, showing a company in transition. Revenue dipped modestly year over year, but ISG continued to deliver meaningful AI-driven strength. CSG remained a drag as PC shipments declined, though management noted early signs of stabilization. Free cash flow held up well, and Dell reiterated its commitment to capital returns through buybacks. Investors reacted positively, pushing the stock up about 3% in after-hours trading.
Key Highlights
- AI servers were the standout again, driving growth in ISG and building a multi-quarter backlog.
- PC revenue declined double digits, pressuring overall margins.
- Management expects sequential margin improvement in Q4 as mix normalizes.
- Free cash flow remained resilient, anchoring Dell’s valuation.
- APEX and recurring-revenue models continued to gain traction, though still a smaller contributor.
SWOT Analysis
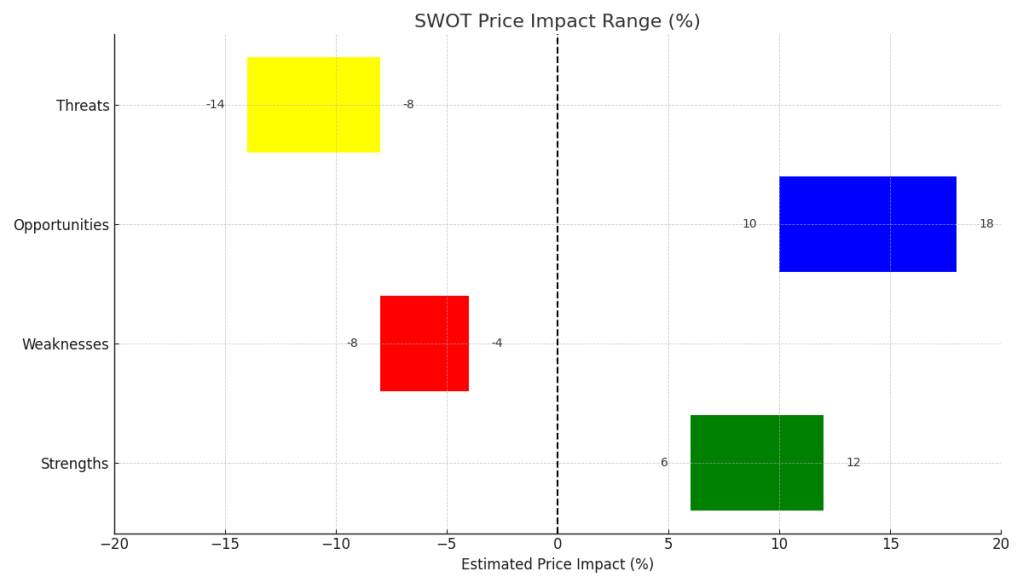
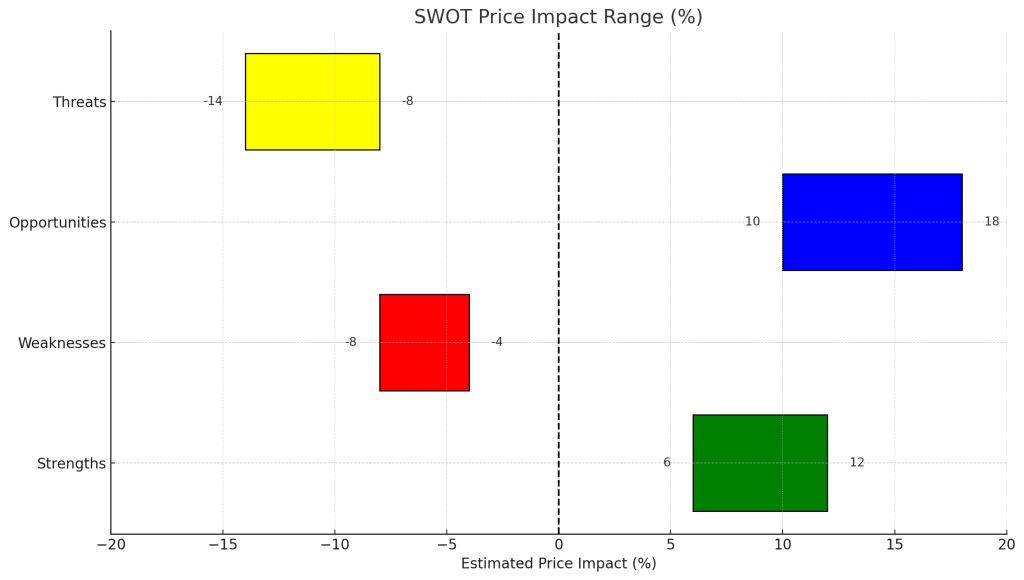
Dell’s investment case sits at the intersection of a cyclical PC recovery and a structurally expanding AI infrastructure market. The company’s cash flow profile and strong enterprise relationships give value-focused investors a stable foundation, while ISG’s AI momentum provides upside optionality. Below is the SWOT snapshot with estimated price impacts.
Strengths (+6% to +12%)
- AI server demand accelerating with solid backlog visibility
- Strong free cash flow supporting continued buybacks
- Deep enterprise relationships and scale as AI workloads expand
- Improving Q4 margin outlook based on mix normalization
Weaknesses (–4% to –8%)
- PC revenue remains in decline, dragging blended margins
- ISG profitability still volatile due to mix-shift in AI servers
- Guidance remains conservative, capping near-term sentiment
Opportunities (+8% to +15%)
- 2026 enterprise AI PC refresh cycle
- Growing on-prem AI infrastructure demand
- Higher-margin recurring revenue through APEX
- Margin expansion potential as AI server costs normalize
Threats (–10% to –18%)
- Hyperscaler spending cycles remain uneven
- Potential margin compression from rapid AI mix growth
- Macro uncertainty affecting corporate capex
- Competitive pricing pressure across ISG
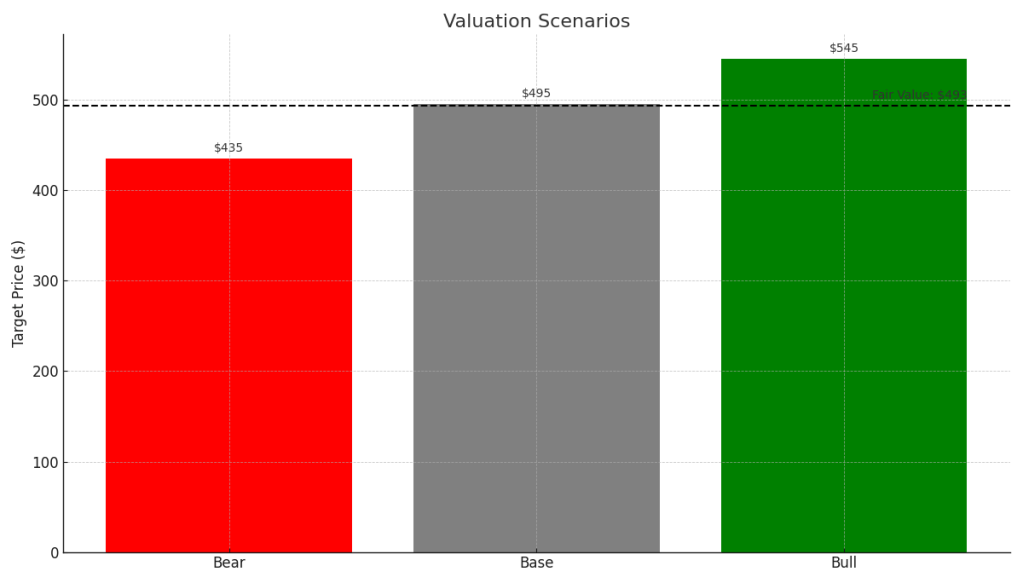
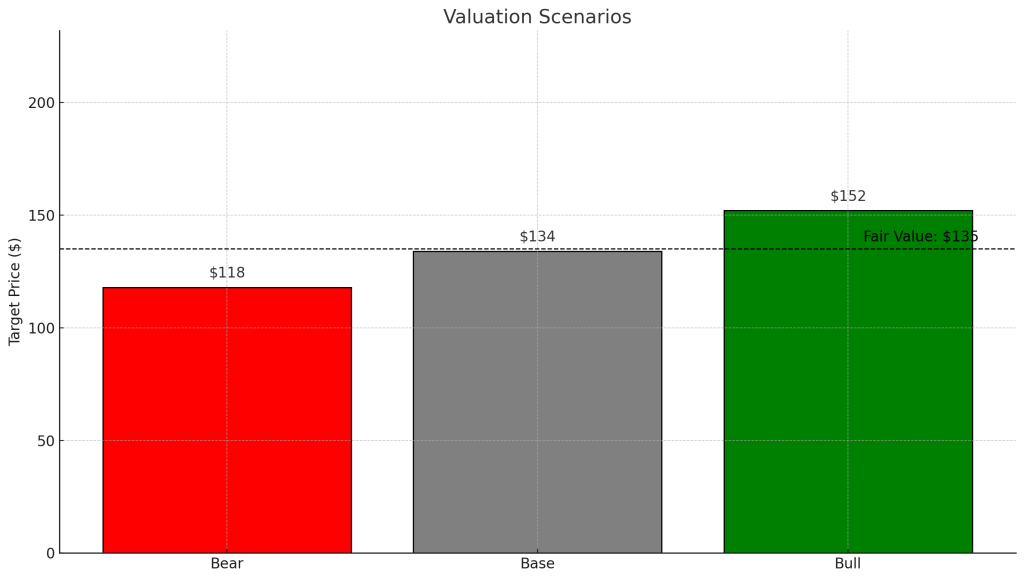
Valuation Scenarios
Our valuation models focus on Dell’s cash flow durability, ISG margin trajectory, and the timing of a PC recovery. We outline three scenarios below, each grounded in Dell’s official Q3 financials and management commentary.
Bear Case — $118
- AI server growth slows; ISG margins stay volatile
- PC recovery delayed beyond FY2026
- Lower EBITDA and discounted cash flow assumptions
Base Case — $134
- AI server demand remains strong; ISG margins stabilize
- CSG begins to recover in late 2026
- Mid-cycle EBITDA multiple applied
Bull Case — $152
- Accelerating AI infrastructure adoption drives ISG margin uplift
- Faster AI PC refresh cycle boosts CSG
- Higher FCF and premium EBITDA multiple
Probability-Weighted Fair Value
- Bear (25%): 118
- Base (50%): 134
- Bull (25%): 152
Final Fair Value: $135
Verdict
Dell’s Q3 results reaffirmed the company’s position as a cash-generating value story with meaningful AI-driven upside. While PCs remain soft, ISG’s momentum and solid Q4 guidance signal a path toward a more balanced and profitable FY2026. At current levels, Dell appears fairly valued around $135, with favorable risk-reward for long-term investors seeking stable cash flow and measured AI exposure.
Call to Action
If you find this breakdown helpful, follow SWOTstock for more AI-focused earnings analysis, valuation updates, and investor-friendly insights across the U.S. equity market.
Disclaimer
This article is for informational purposes only and does not constitute financial advice. All analysis is based solely on official company filings, earnings reports, and management commentary. Investors should conduct their own due diligence or consult a financial advisor before making investment decisions.