Autodesk Q3 FY2026 — AI Clarity Arrives, ARR Strength Holds, and the Stock Jumps

Autodesk reported a strong Q3 FY2026, achieving 11% ARR growth and stable margins, supported by robust revenue of $1.44B. A clarified AI roadmap and increasing traction in Autodesk Platform Services bolstered investor confidence, leading to a 6.1% stock increase. The company maintains positive guidance, but potential risks remain in construction markets.

TL;DR Summary

Autodesk delivered a solid Q3 FY2026 with 11% ARR growth, stable margins, and a clearer AI roadmap that finally met investor expectations. Management reaffirmed full-year guidance and highlighted momentum in Autodesk Platform Services (APS) and generative design workflows. The market reacted positively: shares moved from $294.43 to $312.50 after hours right after the report, reflecting confidence that Autodesk is entering an early multi-year upcycle. Our fair value stands at $305, with upside tied to AI monetization and the pace of cloud platform adoption.


Quarter Recap

Autodesk reported Q3 FY2026 results on November 25, 2025, delivering an encouraging mix of growth and visibility. Revenue reached $1.44B (+10% YoY), supported by strong subscription trends and resilient renewal rates. ARR increased 11% YoY to $6.0B, outpacing expectations and stabilizing concerns around construction end markets.

Margins remained healthy, with non-GAAP operating income near $480M and EPS landing above consensus due to cost discipline and efficient R&D leverage. Free cash flow guidance was reaffirmed, and management emphasized their confidence in both APS and the early rollout of AI-assisted design features.


Key Highlights

  • ARR +11% YoY, ahead of expectations and supported by stable renewal trends.
  • Revenue +10% YoY, demonstrating resilience across AEC and manufacturing.
  • EPS beat driven by stronger margins and operating efficiency.
  • AI roadmap clarified, with early generative design and automated drafting features highlighted.
  • APS gaining traction, boosting attach rates and pricing power.
  • Mixed macro in construction, but not deteriorating.
  • Post-earnings reaction: stock jumped +6.1% after hours, reaching $312.50.
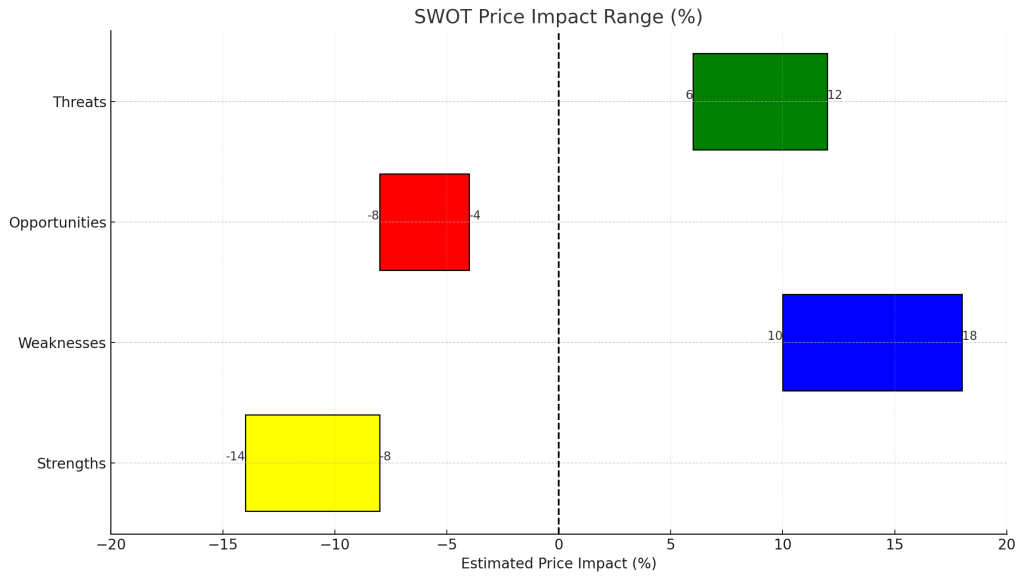
SWOT Analysis

Autodesk heads into 2026 with improving visibility, a stronger ARR engine, and a clearer AI monetization path. The market rewarded the company for delivering above-expectation ARR growth and reinforcing confidence in APS. Risks remain tied to construction cycles, platform migration complexity, and the pace of AI adoption across design workflows.

Strengths (+6% to +12%)

  • Strong ARR growth (+11%) underpins recurring revenue durability and valuation support.
  • Clearer AI roadmap with generative design, automated drafting, and simulation automation.
  • APS platform adoption improves attach rates and expands monetization layers.
  • EPS upside from disciplined cost structure and stable margins.
  • High switching costs across AEC and manufacturing keep retention rates above 100%.

Weaknesses (–3% to –7%)

  • Slight billings deceleration may temper short-term revenue acceleration.
  • AI monetization still early; revenue uplift remains modest for FY2026.
  • AEC macro remains mixed, affecting forward demand visibility.
  • SMB customers remain rate-sensitive, limiting seat expansion.
  • FX remains a drag on international results.

Opportunities (+8% to +15%)

  • AI-assisted design could enable multi-year ARPU expansion across core products.
  • Cloud platform transition (APS) unlocks higher-margin service layers.
  • Manufacturing automation demand supports Fusion 360 growth.
  • Global infrastructure digitization gives long-term AEC tailwinds.
  • Enterprise bundling increases deal sizes and contract duration.

Threats (–8% to –14%)

  • High valuation sensitivity: small ARR misses can lead to multiple compression.
  • AI-first CAD/BIM startups could challenge Autodesk’s pricing power.
  • Regulatory constraints around AI training data may slow product rollout.
  • Construction downturn risk could reduce seat expansions.
  • APS migration execution risks could create customer friction.
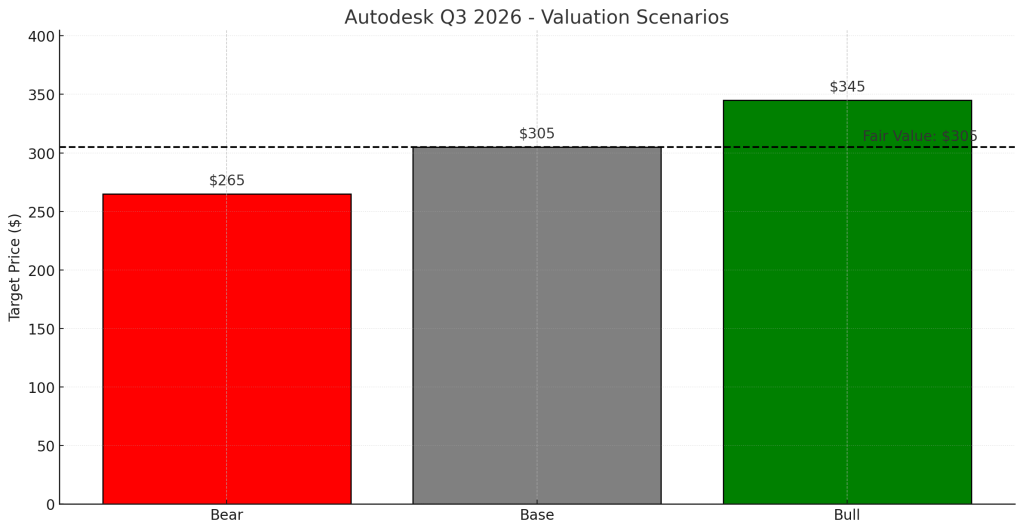
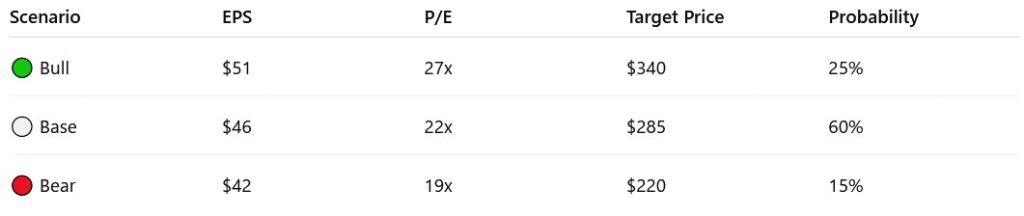
Valuation Scenarios

Autodesk’s valuation depends on the sustainability of ARR growth and the degree to which AI-enabled workflows improve ARPU. With APS adoption and AI clarity increasing, the base case assumes solid recurring revenue momentum and steadily improving free cash flow.

Bear Case — $265

  • ARR slows to 8%.
  • AI monetization slips into late 2027+.
  • Billings decelerate further.
  • Market rerates ADSK to a lower FCF multiple (20–22×).
  • FCF $1.9B × 22× = $265

Base Case — $305

  • ARR maintains 10–11% growth.
  • APS adoption remains strong.
  • Early AI features support modest 2026 ARPU uplift.
  • Market assigns a 24–25× FCF multiple.
  • $2.1B × 24.5× = $305

Bull Case — $345

  • AI tools drive meaningful ARPU expansion.
  • ARR accelerates to 12–13%.
  • Margins expand through automation and bundling.
  • FCF grows to $2.3B at a 27× multiple.
  • $2.3B × 27× = $345

Fair Value

= (0.25×265) + (0.50×305) + (0.25×345)
$305 fair value

Valuation scenarios chart for Autodesk Q3 FY2026 showing Bear ($265), Base ($305), and Bull ($345) price targets with a dashed fair value line at $305.

Verdict

Autodesk is transitioning into a higher-visibility, AI-enhanced software platform. Q3 FY2026 showcased the strength of its recurring model and provided the clearest AI roadmap yet. With ARR reaccelerating and APS gaining momentum, ADSK deserves a premium valuation — but near-term upside depends on the pace of AI adoption and the execution of platform migration.

At $305 fair value, Autodesk looks fairly priced with balanced risk-reward. Growth investors should monitor AI feature launches and renewal behavior as the key catalysts for FY2027 upside.


Call to Action

If you found this analysis useful, follow SWOTstock for more earnings breakdowns, valuation scenarios, and AI-driven insights tailored for long-term investors. New posts drop every week covering tech, AI infrastructure, and software compounding names.


Disclaimer

This article is for informational purposes only and does not constitute financial advice. All analysis is based on publicly available information from Autodesk’s official Q3 FY2026 financial report and earnings call. Investors should perform their own due diligence before making investment decisions.


ASML’s Q3 Performance: Steady Growth Amid Challenges

ASML posted a solid Q3 with €7.5 billion in sales and €2.1 billion in net income, leading to a positive stock reaction. Despite a projected decline in Chinese demand for 2026, management remains optimistic, maintaining a fair valuation of approximately $1,190 per share, indicating significant growth potential driven by AI advancements.

🔎 TL;DR Summary

ASML (AMSL:NASDAQ) just delivered another steady quarter: €7.5 billion in sales, €2.1 billion net income, and margins holding above 51 %. The stock reacted positively in pre-market, climbing ~3 %, as investors looked beyond a cautious China outlook to renewed confidence in ASML’s long-term AI-driven roadmap. Our fair-value model points to ~ $1,190 per share, ≈ 25 % upside.


🧭 Quarter Recap

Management called Q3 “in line with guidance.” Bookings hit €5.4 billion, supported by continued momentum in EUV and early shipments of High-NA EUV systems. The company also highlighted its new AI partnership with Mistral AI, aiming to embed machine-learning control into yield and productivity.

The only dark cloud: ASML expects a “significant decline in China demand in 2026.” Still, management does not foresee overall sales falling below 2025 levels — a sign of resilience amid geopolitical shifts.


💡 Key Highlights

  • Net sales: €7.52 billion | Gross margin: 51.6 %
  • Net income: €2.13 billion | EPS: €5.49
  • Bookings: €5.4 billion | Service revenue: €1.96 billion
  • Guidance: Q4 sales €9.2 – €9.8 billion | Full-year +15 % growth

🧩 SWOT Analysis (Q3 2025)

Strengths (+8 to +12 %) Technological monopoly in EUV and upcoming High-NA tools sustain >50 % gross margin and high visibility.

Weaknesses (−4 to −7 %) Cap-ex cycles and €1.2 billion quarterly R&D keep cash flows volatile.

Opportunities (+10 to +18 %) AI lithography, Mistral AI integration, and High-NA adoption expand ASML’s total addressable market through 2028.

Threats (−8 to −12 %) China sales normalization and export controls could trim €1.5 – 2 billion from 2026 revenue.

Net SWOT bias: +5 % to +9 % upside.

A graph illustrating the SWOT analysis of ASML for Q3 2025, showing estimated price impact ranges for strengths, weaknesses, opportunities, and threats in percentage.
SWOT analysis chart highlighting ASML’s strengths, weaknesses, opportunities, and threats for Q3 2025.

📊 Valuation Scenarios

• Bull Case: ASML’s High-NA EUV rollout and AI-driven lithography adoption accelerate revenue growth above 20 % annually through 2027. → Estimated EPS 2026: €27 | P/E 45× | Fair Value ≈ $1,310 (+44 %).

• Base Case: Steady 15 % growth and margin stability around 52 %. → Estimated EPS 2026: €25 | P/E 40× | Fair Value ≈ $1,080 (+14 %).

• Bear Case: China demand softens (-15 % revenue in 2026) and margins slip to 49 %. → Estimated EPS 2026: €22 | P/E 35× | Fair Value ≈ $830 (-13 %).

🎯 Weighted Fair Value:$1,190 per share (+25 % upside)


Bar chart depicting ASML's valuation scenarios for Q3 2025, with 'Bear' case at $830, 'Base' case at $1080, and 'Bull' case at $1310, along with a dashed line indicating the fair value at $1099.
ASML Q3 2025 Valuation Scenarios: Target prices under Bear, Base, and Bull cases.

🧠 Verdict

ASML remains the “picks-and-shovels” play for the AI era. Even as near-term demand wobbles, its EUV and High-NA roadmap locks in a multi-year growth path few companies can match. For tech-savvy growth investors, the setup still favours accumulation on dips.


💬 Investor Takeaway

Market reaction shows confidence in ASML’s long-term story: from chipmaker orders to AI co-design tools, it continues to define the semiconductor future. Short-term noise aside, the firm’s monopoly position and AI-linked flywheel justify a premium valuation — and our $1,190 fair price reflects that potential.


Disclaimer: This post is for informational purposes only and not financial advice. Please do your own research before investing.

Broadcom Q2 FY2025: AI Momentum Drives Record Revenue—Is the Market Undervaluing This Infrastructure Giant?

Broadcom’s Q2 2025 earnings reveal strong AI chip growth and VMware integration. See our SWOT and fair value estimate showing 17% upside potential.

💡 TL;DR – Pullback Presents Opportunity in a Structurally Strong Business

Broadcom (NASDAQ: AVGO) posted a record-breaking quarter, driven by surging AI demand and expanding software margins, yet the stock declined due to high expectations already priced in. With solid free cash flow, growing custom AI deployments, and a credible software growth engine, our fair value estimate points to +17% upside. This may be one of those rare “buy-the-dip” chances in a business executing on multiple growth vectors.


📊 Quarter Recap – Strong Execution Meets High Expectations

Broadcom delivered a strong Q2 FY2025, with $15.0 billion in revenue, up 43% YoY. The AI semiconductor segment grew 46% YoY to $4.4 billion, marking the ninth consecutive quarter of AI-led growth. On the software side, VMware and VCF added $6.6 billion, a 25% YoY gain.

Margins remained exceptional: 79.4% gross margin, $6.4 billion in free cash flow (43% of revenue). Yet the market response was muted. The stock pulled back ~5% post-report as guidance aligned with expectations, not exceeding them.

Line chart showing Broadcom’s quarterly revenue and net income from Q2 2024 to Q2 2025, highlighting a sharp increase in Q2 2025 driven by AI and software growth.

🔑 Management Commentary – Scaling AI, Monetizing Software

Broadcom reaffirmed its bullish stance on AI growth. Management guided for 60% YoY growth in AI chip revenue in Q3 and reiterated their target of AI comprising 35% of total revenue by year-end.

CEO Hock Tan emphasized:

“We’re in the early stages of a multi-year infrastructure buildout. Our custom AI accelerators are now in production with three hyperscalers and being evaluated by several more.”

To support hyperscaler workloads, Broadcom also launched the Tomahawk 6 switch, offering 102.4 Tbps bandwidth—a key enabler of ultra-dense AI clusters.

Meanwhile, VMware integration continued as planned. Management highlighted strong ARR and price leverage in its infrastructure software offerings, further enhancing Broadcom’s blended margin profile.


🧠 SWOT Analysis – Strategy and Market Sensitivity

Horizontal bar chart for Broadcom Q2 2025 showing stock price impact ranges by SWOT element: Strengths (+20 to +40), Opportunities (+15 to +25), Weaknesses (–10 to –5), and Threats (–15 to –10) in USD.

✅ Strengths (+20 to +40 USD/share)

Dual revenue engines—custom AI chips and recurring software—set Broadcom apart. Gross margins and free cash flow generation remain world-class. Management visibility into multi-quarter AI demand de-risks execution.

❌ Weaknesses (-5 to -10 USD/share)

Legacy semiconductor segments like broadband and storage connectivity remain under pressure. VMware integration, though progressing, adds near-term complexity.

🚀 Opportunities (+15 to +25 USD/share)

The hyperscaler pipeline is expanding, and each deployment carries material revenue potential. If even one new customer finalizes deployment by year-end, upside to AI projections may materialize early. Software bundling (hardware + VCF) could also open a new monetization layer.

⚠️ Threats (-10 to -15 USD/share)

Investor expectations are high. A single quarter of missed growth or a slower ramp from a hyperscaler could compress multiples quickly. Integration drag or logistical ramp issues also remain execution risks.


📋 SWOT Summary Table


💰 Valuation Scenarios – Grounded Upside Based on Execution

We modeled three outcomes based strictly on Broadcom’s own forward guidance and commentary.

Bar chart of Broadcom Q2 2025 valuation scenarios showing Bear Case ($220), Base Case ($285), Bull Case ($340), and a separate bar for Current Price ($247), with a dotted line marking fair value at $289.

🟢 Bull Case – $340/share (25%)

If Broadcom successfully scales to 5+ hyperscaler customers and executes VMware integration smoothly, EPS could rise to $51, supported by a 27x P/E.

⚪ Base Case – $285/share (60%)

The most probable path: strong, steady AI growth and normalized software contribution. EPS reaches $46, with a 22x multiple.

🔴 Bear Case – $220/share (15%)

Execution delays or margin pressure reduce EPS to $42, and a 19x multiple results in $220/share.


🧮 Weighted Fair Value Calculation

(0.25×340)+(0.60×285)+(0.15×220)=289.00

📌 Fair Value: $289/share
📉 Current Price: $247/share (as of June 6, 2025)
📈 Upside Potential: +17%


🏁 Verdict – Quality Name With Re-Rating Potential

The short-term pullback seems more about timing than fundamentals. Investors may have front-loaded expectations ahead of earnings, creating a mismatch. Yet Broadcom’s long-term visibility, growing software margins, and accelerating AI scale-ups suggest the story remains intact.

📉 Technical note: The stock is approaching prior support near $235–245, which also aligns with March consolidation levels—an area long-term investors may be watching.


📢 Call to Action

Broadcom represents a high-quality, cash-generating, AI-fueled compounder. If you’re looking for a name with both infrastructure exposure and durable software margins, the current setup may offer an attractive entry. Bookmark or share this post as Broadcom rolls into the second half of FY2025.


⚠️ Disclaimer

All analysis in this post is based exclusively on Broadcom’s official Q2 FY2025 financial disclosures and earnings call commentary. This is not investment advice.


Leave a comment