

If you follow enterprise tech, you’ve probably noticed that “edge AI” has shifted from buzzword to board-level priority. Companies want AI that runs close to where data is created—on phones, sensors, cameras, factory lines, cars—so decisions happen in milliseconds, data stays private, and costs don’t balloon in the cloud. This article looks at where Accenture sits in that shift, how crowded the field has become, and what all of this could mean for the stock. I’ll keep the tone conversational and minimize bullet points, while still laying out a clear, investor-minded view with a fair-value estimate at the end.
Edge AI, briefly—why it matters now
Edge AI means running models locally on devices rather than shipping everything to cloud data centers. The benefits are straightforward: lower latency, better privacy, less bandwidth, and the ability to operate even when connectivity is spotty. Think of a security camera that flags anomalies on-device, a factory sensor that predicts failures in real time, or a car that fuses vision and language models to assist the driver without calling home.
Generative AI gets more headlines, but edge AI sits where operational value is created—on the shop floor, in vehicles, at retail, inside hospitals. The two are connected: many enterprises will pair cloud-scale GenAI with compact models running at the edge. Any services firm that can bridge that gap has a shot at premium work.
How Accenture has built its edge-AI muscle
Over the last couple of years Accenture has been stitching together a mix of consulting depth and hands-on engineering. It acquired silicon design firms (Excelmax and Cientra), invested in a model-compression startup (CLIKA), and trained a very large portion of its workforce in AI practices. That combination lets the company talk strategy with the C-suite, design and test solutions with embedded systems teams, and then scale deployments across dozens of plants or thousands of devices. Few consultancies can credibly do all three.
Just as important, Accenture already sits inside the industries where edge AI is landing first: manufacturing, automotive, telecom, healthcare, energy. Those client relationships, plus a broad partner web with chipmakers and cloud providers, position the company to win repeat work as pilots graduate to rollouts.
The competitive reality
This is not an empty field. On the platform and hardware side, NVIDIA, Qualcomm, Intel, Apple and others drive silicon and software stacks; hyperscalers offer toolchains that extend to the edge; consulting rivals like IBM and Capgemini bring strong engineering pedigrees; Deloitte and McKinsey remain influential with boards and regulators. In a crowded landscape, Accenture’s edge is less about owning a platform and more about orchestrating outcomes—choosing the right models and hardware, compressing them to fit, integrating with legacy systems, and running change management at enterprise scale.
SWOT analysis with price impacts
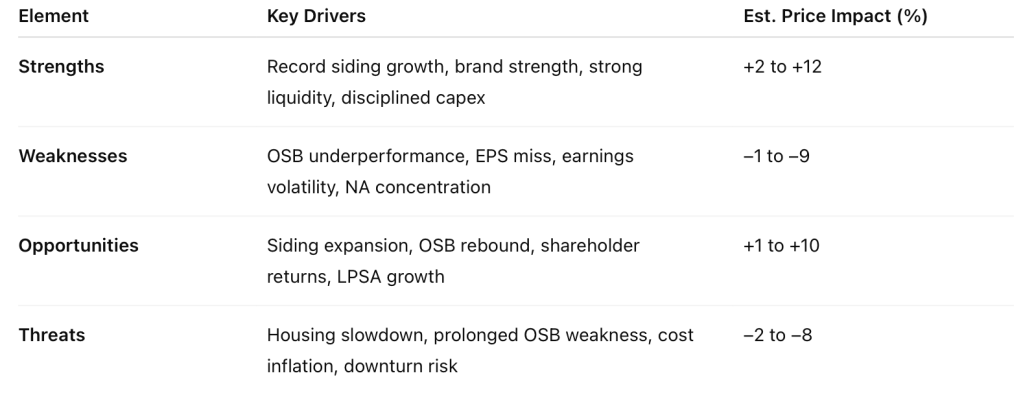
Accenture’s strengths in edge AI are unusually tangible for a services firm. The chip-design acquisitions and the investment in model optimization give it a way to reduce the “last mile” friction that often kills edge projects: getting models small, fast, and reliable on constrained devices. Coupled with its global delivery network, that capability can add real growth optionality. In valuation terms, I see those strengths supporting roughly +5% to +8% upside versus a no-edge-AI baseline, because investors tend to pay up for firms that can both advise and execute.
Weaknesses are more prosaic but matter. Accenture does not sell chips or devices, so it relies on partners for the building blocks. And because the company is already very large, even successful edge programs may represent a modest slice of overall revenue for a while. Those factors can dampen the multiple and shave –2% to –4% from what otherwise looks like an AI-premium narrative.
Opportunities are where things get interesting. Edge AI spending is compounding as factories modernize, cars become rolling computers, and hospitals instrument workflows. Accenture can bundle cloud GenAI and on-device intelligence into “reinvention” programs that attack cost, speed, and safety at once. If execution matches the pipeline, that story can support another +7% to +12% of valuation tailwind as investors price in higher growth durability.
Threats are real and mostly competitive. If hardware vendors and hyperscalers push turnkey offerings faster than expected, services can look more like commodity integration. If clients deploy more slowly, or if ROI takes longer to prove in regulated industries, momentum can stall. Put a –3% to –6% drag on valuation for those risks and you have a balanced, but still favorable, tilt.

Scenarios and fair value (illustrative)
Because Accenture doesn’t break out “edge AI revenue” as a line item, we model the impact at the level investors actually trade on: earnings power and the multiple the market is willing to pay. To keep this grounded, I anchor on reasonable ranges for EPS growth and P/E by 2030, then weigh the outcomes.
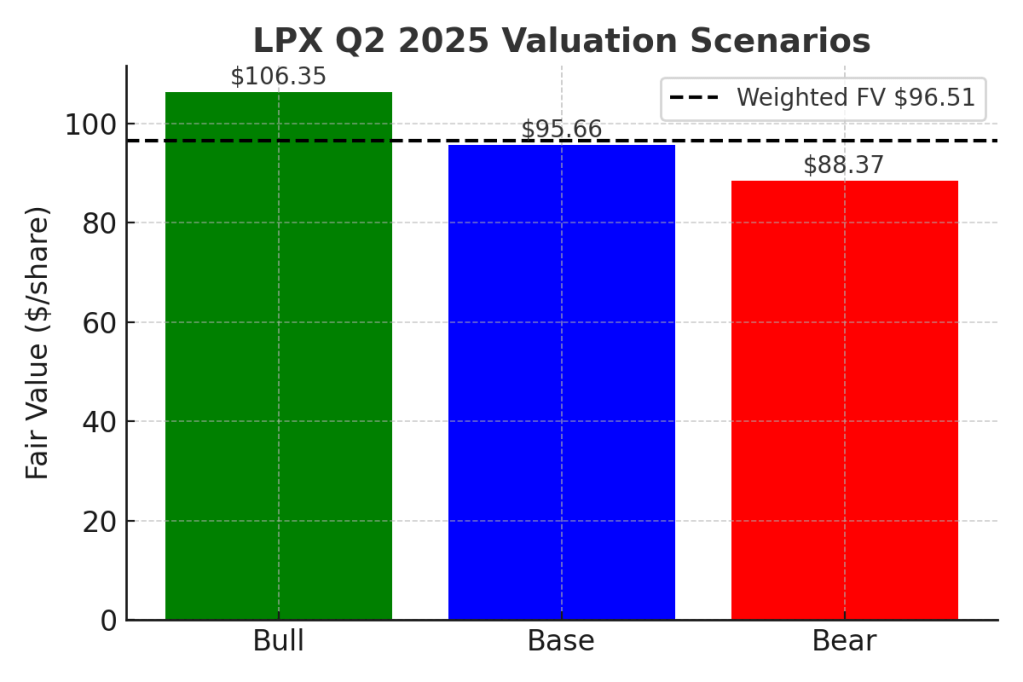
Bull case (40% probability). Edge programs scale alongside cloud GenAI work. AI-related revenue becomes a visible growth wedge, margins hold, and investors reward execution. If EPS reaches about $16 by 2030 and the market assigns a 28× multiple, you get an implied price near $448.
Base case (45%). Edge AI contributes meaningfully but remains under 10% of total revenue. Growth is steady, not explosive. With EPS around $14 and a 25× multiple, the implied price is about $350.
Bear case (15%). Adoption is slower, work skews toward integration, and the multiple compresses. With EPS near $12.5and a 22× multiple, the stock sketches to roughly $275.
Weighting those three paths yields a probability-weighted fair value of ~$378. It is not a moonshot number; it reflects confidence that Accenture will keep winning complex, multi-year AI programs where edge and cloud meet, without assuming platform-owner economics.
(Note: current share price fluctuates; the scenario math is illustrative rather than price-tick precise.)

What could change this view
Two things would push the needle higher. First, proof that model-compression and embedded engineering are shortening time-to-value on real deployments—think a global auto program or a multi-country factory network moving from pilot to standard with measurable savings. Second, clearer disclosure connecting AI bookings to revenue and margin expansion, so investors can track conversion rather than treating it as a narrative line.
On the downside, watch for customers delaying capital plans, hyperscalers tightening their grip on the edge toolchain, or a visible shift in project mix from “design and build” to lower-margin staff augmentation.
Bottom line
Edge AI isn’t a side show; it’s the place where AI meets the physical world. Accenture’s blend of consulting reach, embedded engineering from its acquisitions, and model-optimization capability puts it in a strong position to lead enterprise edge deployments. The field is busy and the company is already large, so don’t expect edge AI alone to redefine the business overnight. But as part of a broader AI reinvention engine, it can support healthier growth and a sturdier multiple. On the numbers above, that argues for a fair value around $378, with the bias skewed to the upside if execution stays crisp.
Disclosure & methodology: This article synthesizes public information on Accenture’s recent acquisitions and AI investments, industry reports on edge-AI adoption, and a scenario framework based on plausible EPS and P/E ranges through 2030. Accenture does not separately disclose edge-AI revenue, so assumptions are required; figures are illustrative, not precise forecasts. This is for education and discussion only and is not investment advice.


Leave a comment