

TL;DR
Bank of America posted Q2 2025 EPS of $0.89, topping expectations, driven by record net interest income and robust trading revenue. Management reaffirmed NII guidance toward $15.5–$15.7 billion and announced an 8% dividend hike (raising forward yield to ~3.2%). While credit risks in commercial real estate and macro uncertainties persist, BAC remains fairly valued near $48, making it a steady, income‑oriented choice for DIY value investors.
Quarter Recap
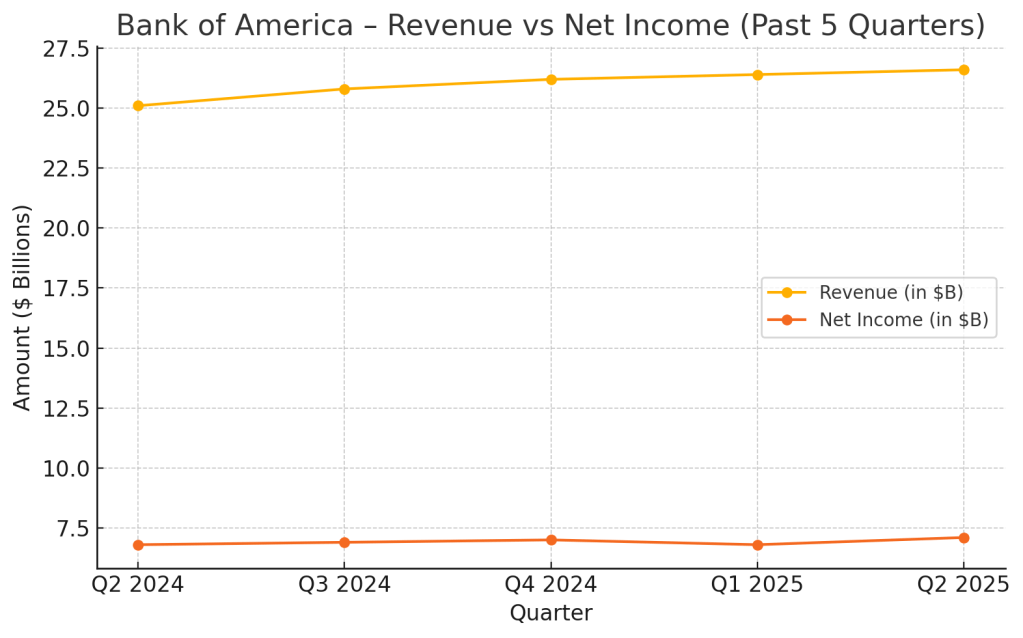
In Q2 2025, Bank of America reported revenue of $26.6 billion (+4% YoY) with net interest income (NII) reaching $14.8 billion — a record high. Net income rose to $7.1 billion (EPS $0.89), beating estimates by 3 cents.
Management highlighted:
- Efficiency progress: Non‑interest expenses dropped ~$600 million QoQ, with a target to reach ~60% efficiency ratio.
- Deposit strength: 8th straight quarter of deposit growth, with average checking balances rising from $6K to $9.2K YoY.
- Credit costs: Provisions increased to ~$1.6 billion, mainly from office‑related CRE loans.
- Trading resilience: Markets revenue rose ~15% YoY, with management expecting a 13‑quarter growth streak to continue.
- Shareholder returns: $7.3 billion in Q2 (dividends + buybacks) and an 8% dividend increase announced for Q3.
Key Highlights
- EPS: $0.89 (+7% YoY), beat by 3 cents
- Revenue: $26.6 billion (+4% YoY)
- Net Interest Income: $14.8 billion (record)
- Efficiency: Expenses down $600 million QoQ; targeting ~60% ratio
- Dividend: 8% hike brings forward yield to ~3.2%
- Asset quality: Net charge‑offs of $1.5 billion; provisions up to $1.6 billion
- Deposits: 8th consecutive quarter of growth
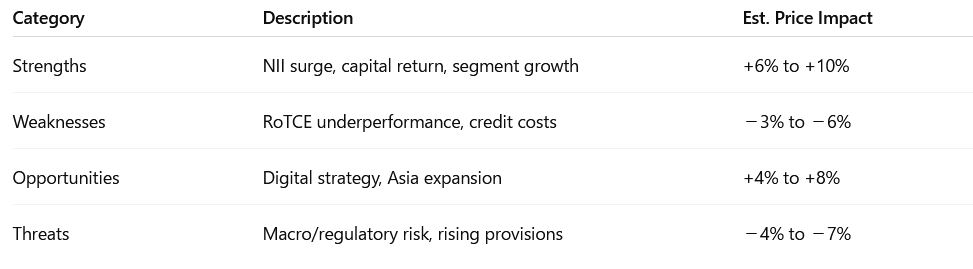
SWOT Analysis
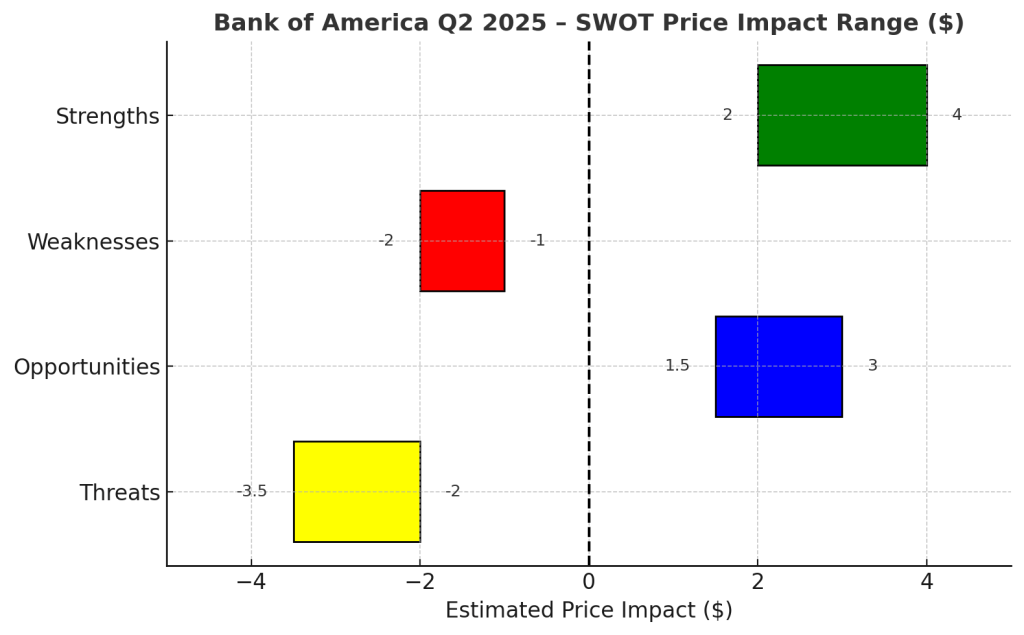
- Strengths (+$2 – 4 impact):
Record NII, diversified revenue streams, improving efficiency, and a dividend hike reflecting capital confidence. - Weaknesses (−$1 – 2 impact):
Slower revenue growth than peers, elevated CRE‑related losses, and a still‑high expense base. - Opportunities (+$1.5 – 3 impact):
AI & digital investments, sustained deposit momentum, expanding trading revenue, and higher dividend yield enhancing total return. - Threats (−$2 – 3.5 impact):
Tariff‑driven macro risks, potential Fed rate cuts compressing NII, and rising credit costs in commercial real estate.
Net price impact: ≈ +$1.0–1.5/share vs. pre‑earnings levels, supporting the current range.
SWOT Summary Table

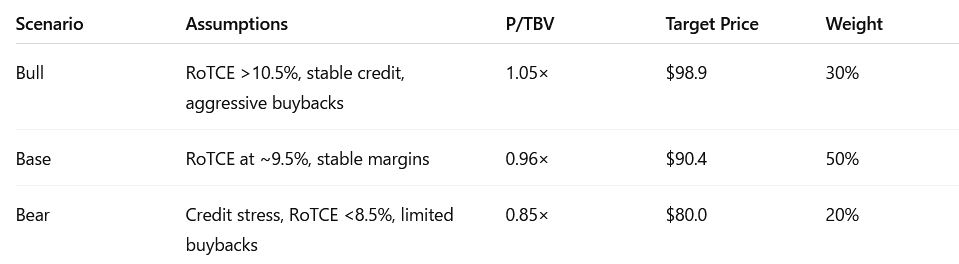
Valuation Scenarios
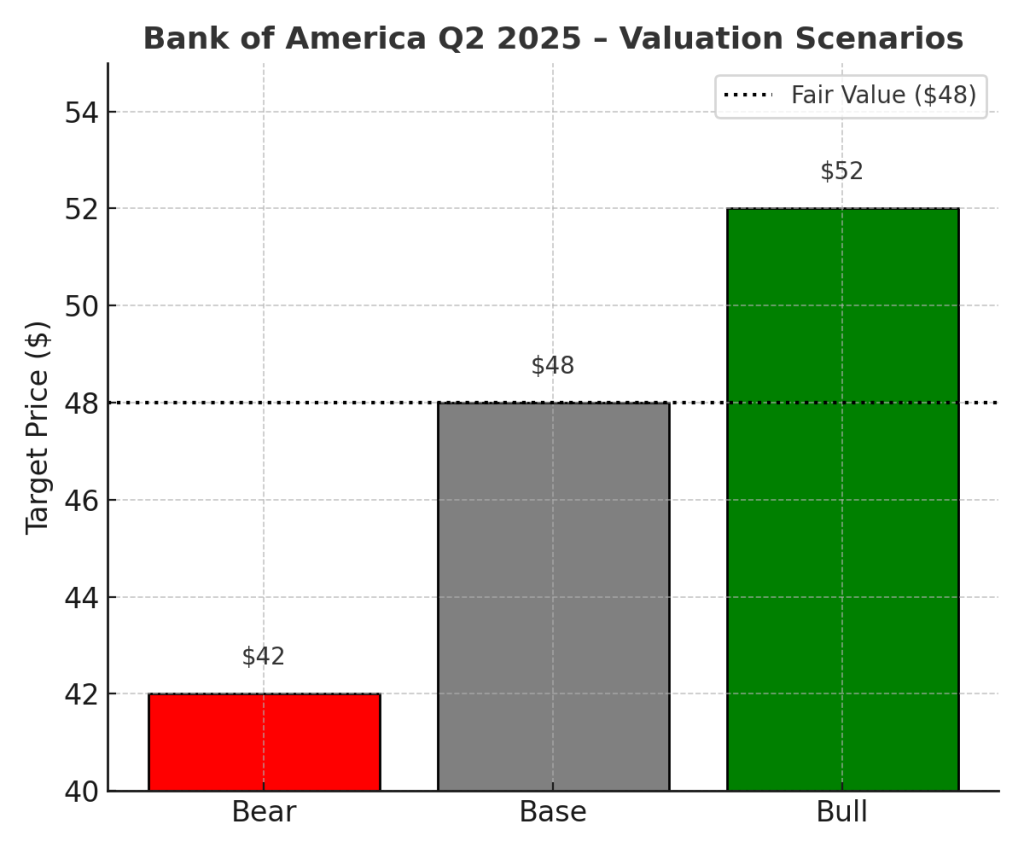
To frame a realistic outlook for Bank of America’s stock, we modeled three scenarios based on management’s guidance, Q2 results, and macro risks. The Base Case assumes steady EPS growth, stable net interest income, and controlled expenses, keeping the stock near its current range. The Bull Case reflects a scenario where trading revenue momentum accelerates, the efficiency ratio improves faster toward the 60% target, and net interest income benefits from a slower‑than‑expected pace of Fed rate cuts. Conversely, the Bear Case factors in higher commercial real estate charge‑offs and a compressed margin environment from rapid rate cuts. These scenarios give a clear range of plausible outcomes for value investors, balancing potential upside with key risks.

Probability‑Weighted Fair Value:(0.5 × 48) + (0.3 × 52) + (0.2 × 42) ≈ $48
Dividend Growth Snapshot
Bank of America’s 8% dividend hike for Q3 2025 raises the quarterly payout from $0.24 to $0.26 per share, pushing the forward yield to roughly 3.2% at current prices. This increase continues the bank’s consistent multi‑year trend of dividend growth, reflecting management’s confidence in earnings stability and capital strength. Combined with $7.3 billion in share buybacks during Q2, this makes BAC a compelling choice for income‑focused investors who prioritize reliable cash returns and long‑term capital appreciation.

- Q2 dividend: $0.24/share → Q3: $0.26/share
- 8% increase = forward yield of ~3.2% at $48/share
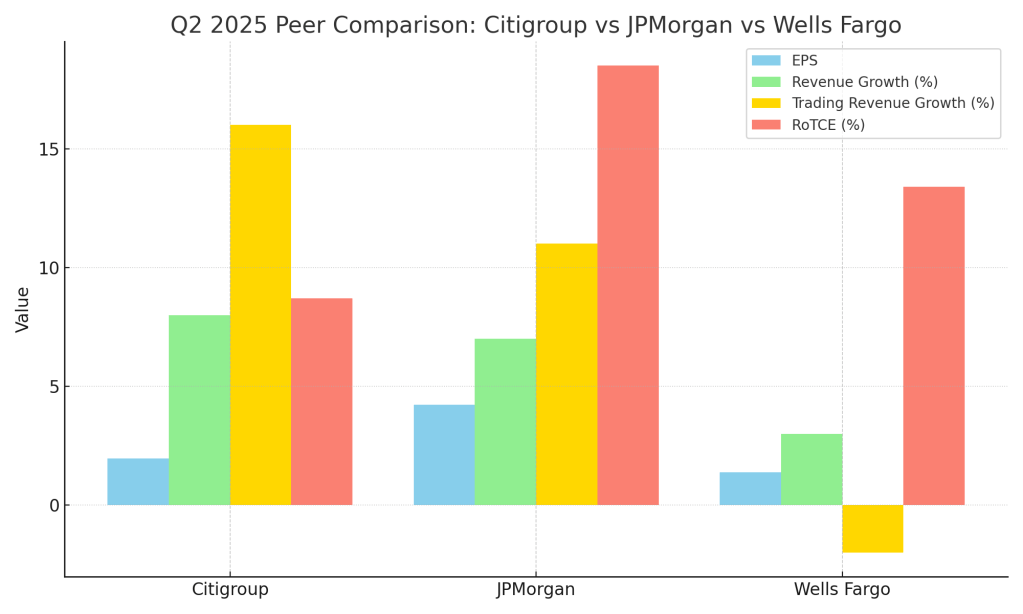
Peer Comparison
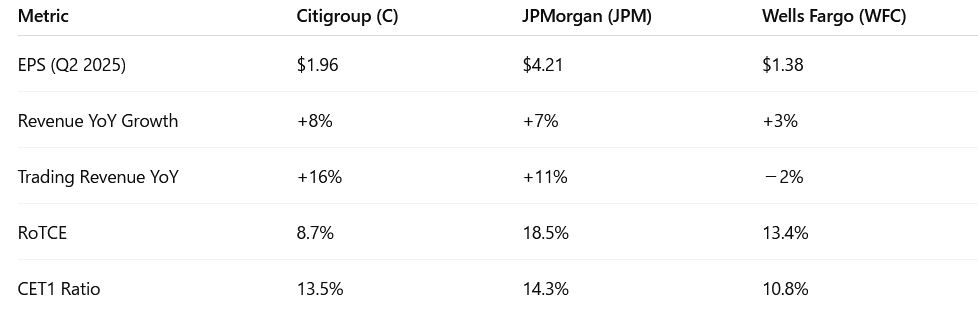
When compared to its large‑cap U.S. banking peers, Bank of America sits in the middle of the pack. At a price‑to‑book ratio of ~1.3× and forward P/E around 13×, it trades cheaper than JPMorgan (P/B ~1.6×, P/E ~12×) but at a premium to Citigroup (P/B ~0.8×, P/E ~9×). Dividend yield at ~3.2% (post‑hike) makes BAC more attractive than JPMorgan (~2.8%) but still below Citi’s ~4%. This positioning reflects its balanced profile: steadier than Citi, but with less growth momentum than JPMorgan — a mix that appeals to value‑oriented investors seeking income without extreme risk exposure.

Verdict
At ≈$48/share, BAC trades close to our fair value estimate. For DIY value investors, it offers steady dividends, aggressive buybacks, and a resilient balance sheet. While upside is modest without macro support, the dividend hikeand sustained trading & deposit growth make it a hold‑to‑accumulate for long‑term portfolios.
Call to Action
Do you hold Bank of America or other bank stocks? Comment below — is BAC your top pick for steady income, or do you prefer peers like Citi or JPMorgan?
Disclaimer
This analysis is for informational purposes only and based solely on Bank of America’s official Q2 2025 financial report and earnings call. It does not constitute financial advice. Please consult a licensed advisor before making investment decisions.


Leave a comment