Walmart Q1 2025: E-Commerce Turns a Profit—But Is That Enough for the Stock to Break Out?

Walmart reported strong Q1 FY2026 results, with sales rising to $165.61 billion and e-commerce profitability achieved globally. Despite these positives, stock prices remained flat due to inflation, pricing pressures, and a lack of EPS guidance. While Walmart presents growth opportunities, macroeconomic risks traditionally temper investor enthusiasm.

Quick Take: Steady Growth, But Macro Risks Keep a Lid on the Rally

Walmart (NYSE: WMT) delivered a strong Q1 with rising sales, expanding operating income, and—most importantly—e-commerce profitability. Yet the stock barely moved. Why? Inflation, pricing pressure, and the decision to withhold EPS guidance signal near-term caution. For long-term, low-risk growth seekers, Walmart still looks like a solid bet, but now’s the time to watch execution closely.


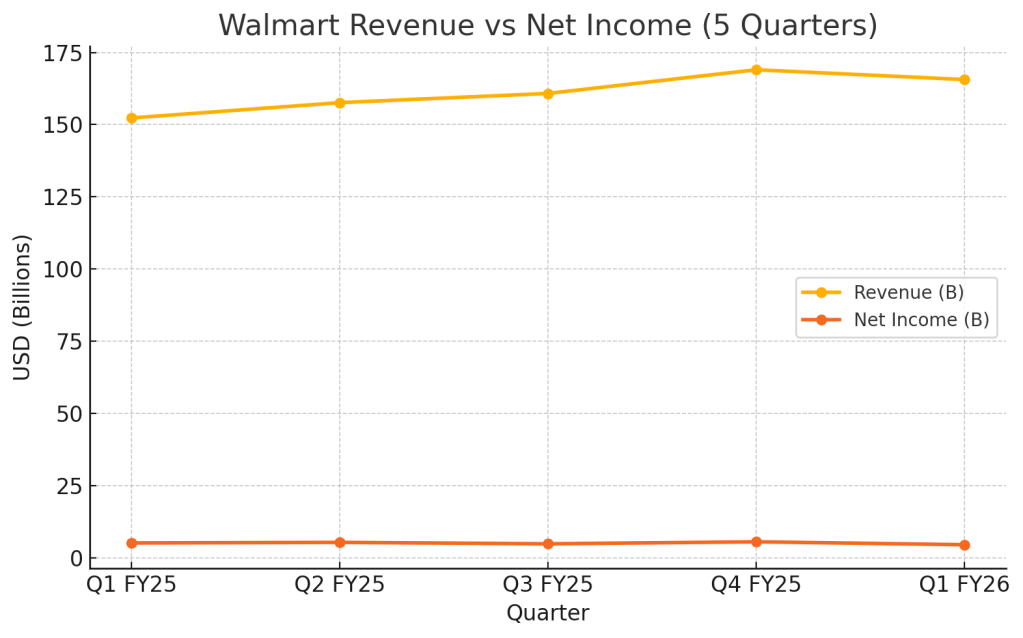
Quarter Recap: A Landmark Quarter, But Tariff Warnings Weigh Heavily

Walmart’s Q1 FY2026 (calendar Q1 2025) showed revenue of $165.61 billion (+2.5% YoY), with operating income up 4.3%. U.S. comparable sales rose 4.5%, driven by strong performance in food and pharmacy. A standout highlight: e-commerce operations became profitable globally—a signal that Walmart’s long-term tech investments are beginning to pay off.

Despite this, the stock dipped –0.5% during regular trading and was down 4% at open, after an initial premarket rise. The reason? CEO Doug McMillon acknowledged that Walmart would raise prices in response to persistent tariffs. And critically, the company withheld EPS guidance, citing economic uncertainty.

Why this quarter matters: Walmart just hit a key profitability milestone in digital—but cost pressures and visibility concerns are limiting investor enthusiasm.


Walmart Q1 2025 – Key Financial Highlights

  • Revenue: $165.61B (+2.5% YoY)
  • Net Income: $4.49B (down from $5.10B YoY)
  • EPS: $0.61 (beat by $0.03)
  • U.S. Comp Sales: +4.5%
  • Global E-commerce Sales: +22% YoY
  • E-commerce Profitability: First time achieved globally
  • Operating Income: +4.3%
  • FY Guidance: Reaffirmed 3–4% sales growth; EPS guidance withheld
Line chart showing Walmart's revenue and net income trend over five quarters, highlighting solid sales with recent profit compression.

Walmart vs. Amazon vs. Target: Who’s Winning the Retail Transformation?

MetricWalmartAmazonTarget
E-commerce ProfitabilityAchieved (Q1 2025)Long-establishedStill lagging
In-store Sales Growth+4.5% U.S. compsMinimal (no store footprint)Flat to slightly negative
Ad Revenue MonetizationExpanding (Walmart Connect)Robust (Amazon Ads)Early stage
Inventory StrategyAI + automation scalingLogistics leaderStruggling with excess
Guidance ToneCautious, no EPS givenConfidentDefensive, cost-cutting

Takeaway: Walmart is the only large-format retailer with profitable e-commerce and store traffic momentum. It lags Amazon in tech monetization but is clearly outpacing Target in operational agility.


SWOT Breakdown: Walmart’s Digital Wins Meet Margin Headwinds

Let’s break it down using a simple SWOT framework—what’s going well, what’s not, where the upside lies, and what risks could derail the story.

Strengths

Walmart is scaling e-commerce profitably while growing in-store comps. Fulfillment efficiency and automation are boosting operating income.

Stock Price Impact Estimate:
Could support a +$3 to +$5 upside if this continues.

Weaknesses

Margins remain pressured. Net income declined, and the decision not to issue EPS guidance raises questions about confidence in short-term forecasting.

Stock Price Impact Estimate:
Could cap the stock by –$1 to –$3 per share.

Opportunities

Automation, Walmart+, advertising, and health services offer high-margin growth channels. AI integration in logistics and demand planning could unlock additional EPS upside.

Stock Price Impact Estimate:
If scaled well, could add +$4 to +$6 to valuation.

Threats

Tariffs, inflation, and pricing action could impact demand—especially in general merchandise. Management’s caution suggests macro risk isn’t fully priced in.

Stock Price Impact Estimate:
Worst-case downside of –$4 to –$6.
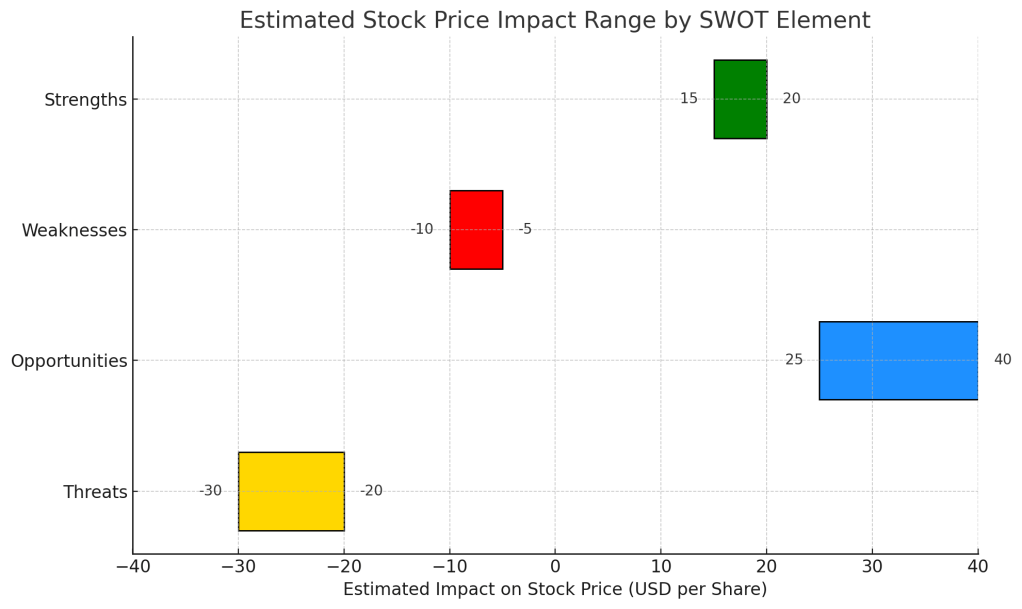
Horizontal bar chart estimating stock price impact ranges for Walmart’s Q1 2025 SWOT elements: strengths, weaknesses, opportunities, and threats.

SWOT Table Summary

CategoryKey TakeawaysEst. Stock Impact
StrengthsSolid comp growth, e-commerce profitability+$3 to +$5
WeaknessesMargin pressure, EPS visibility unclear–$1 to –$3
OpportunitiesMonetization of tech, AI, memberships, ad platform+$4 to +$6
ThreatsTariffs, inflation, pricing backlash–$4 to –$6
Four-quadrant SWOT chart summarizing Walmart’s Q1 2025 strengths, weaknesses, opportunities, and threats with the Walmart logo in the center.

Valuation Scenarios: How Walmart Stock Could Play Out from Here

Let’s revisit Walmart’s valuation in light of its solid operational execution, profitability in e-commerce, and the macro risks it faces. With the current stock price at $96.35, here’s how the stock could move in three realistic scenarios.


Base Case (Most Likely – 50%)

  • Summary: Walmart maintains low-single-digit revenue growth, keeps e-commerce profitable, and stabilizes margins with the help of automation and better inventory management. However, wage inflation and tariffs continue to pressure near-term earnings. EPS growth remains modest, and valuation multiples stay flat.
  • Fair Value Estimate: $100
  • Probability: 50%

Bull Case (Optimistic – 30%)

  • Summary: Walmart’s automation and AI-driven efficiencies begin to show stronger results, driving margin expansion. Advertising and subscription revenue accelerate, and general merchandise demand rebounds despite pricing headwinds. The company regains multiple expansion as investors price in stronger long-term profitability.
  • Fair Value Estimate: $110
  • Probability: 30%

Bear Case (Downside – 20%)

  • Summary: Consumer demand weakens as inflation and tariff-related pricing continue to rise. Walmart is forced to absorb more costs to maintain competitiveness, leading to margin compression. EPS flattens or declines. Valuation contracts slightly due to uncertainty around macro execution.
  • Fair Value Estimate: $85
  • Probability: 20%
Bar chart showing Walmart's valuation scenarios—bear, base, and bull—based on Q1 2025 performance and forward outlook.

Weighted Average Fair Value Calculation

(64×0.5)+(72×0.3)+(52×0.2)=$64.00


Valuation Verdict

With the current price at $96.35 (as of May 15, 2025), Walmart appears slightly undervalued based on its fundamental performance and risk-balanced outlook. For long-term, growth-conscious investors seeking resilience and scalable upside, Walmart may offer a reasonable entry point—especially if the company can maintain its digital momentum while defending margins.


Call to Action

Want focused stock breakdowns like this for every major earnings report?
Subscribe now for no-jargon, data-backed posts you can trust.


Disclaimer

This analysis is based solely on Walmart’s official Q1 FY2026 financial report and earnings call transcript. It is not investment advice. Please do your own research before investing.


Leave a comment

Cisco Q3 FY2025: Dividend Still Solid, Value Emerging — But Is the Splunk Deal a Risk or Reward?

Cisco reported strong Q3 FY2025 results with revenue of $14.15 billion and an EPS of $0.96, beating expectations. The Splunk acquisition offers growth opportunities despite integration risks. The stock is fairly valued at ~$61, providing a 2.6% dividend yield, making it appealing for long-term investors, despite macroeconomic and competitive threats.

Key Takeaways for Income & Value Investors

Cisco (NASDAQ: CSCO) delivered a strong Q3 FY2025, beating expectations and reaffirming its role as a dividend staple. The completed Splunk acquisition adds risk—but also opportunity in cybersecurity and observability. At ~$61, the stock appears fairly valued, with solid yield, modest upside, and limited downside—making it attractive for long-term dividend investors.


Cisco Q3 2025 Earnings Summary

  • Revenue: $14.15 billion (+11% YoY)
  • Non-GAAP EPS: $0.96 (vs. $0.92 guidance)
  • GAAP EPS: $0.62
  • Operating cash flow: $5.2 billion
  • Dividend paid: $1.6 billion
  • Share repurchases: $1.5 billion
  • Free cash flow payout ratio: ~61%
  • Forward dividend yield: ~2.6%
  • Free cash flow yield: ~6.8% (on trailing FCF of ~$15B)
ine chart showing Cisco’s revenue growth and non-GAAP EPS trends over the last five quarters, highlighting consistent financial performance through Q3 FY2025.

Key Highlights This Quarter

  • AI Orders Surge: $600M+ in Q3, exceeding $1B fiscal YTD
  • Capital Return: $3.1B to shareholders (buybacks + dividends)
  • Splunk Acquisition: $28B deal now closed, expanding security + analytics
  • FY2025 Guidance Raised: Modest bump in revenue and earnings outlook
  • CFO Change: Mark Patterson to succeed Scott Herren in July

SWOT Analysis (Based on Cisco’s Official Earnings Report & Call)

Strengths

Cisco remains a cash flow powerhouse with predictable returns. It beat guidance, raised full-year forecasts, and maintained a consistent capital return policy. AI orders and secure networking sales accelerated.

Estimated Stock Price Impact: +$8 to +$12

Weaknesses

The security portfolio underperformed, and the integration of Splunk introduces both cultural and execution risks. These could delay synergy realization or weigh on margins short-term.

Estimated Stock Price Impact: –$4 to –$6

Opportunities

Cisco’s software transition, fueled by Splunk, gives it greater recurring revenue potential. Emerging bets like quantum computing and AI-integrated infrastructure add long-term optionality.

Estimated Stock Price Impact: +$5 to +9

Threats

Enterprise IT spending remains vulnerable to macro pressures. Cisco also faces intense competition from hyperscalers and specialized security firms. The CFO transition may cause short-term strategic jitters.

Estimated Stock Price Impact: –$5 to –$8


SWOT Summary Table

SWOT CategoryKey DriverEst. Stock Price Impact
StrengthsEarnings beat, AI orders, dividend reliability+8 to +12
OpportunitiesSoftware shift, Splunk synergy, R&D expansion+5 to +9
WeaknessesSecurity miss, integration risk–4 to –6
ThreatsMacro exposure, competition, leadership change–5 to –8

Horizontal bar chart illustrating Cisco’s estimated stock price impact by SWOT category—Strengths, Weaknesses, Opportunities, and Threats—with clearly labeled ranges.

Cisco Stock Valuation Scenarios Based on FY2025 Guidance

ScenarioEPS (FY25E)P/E MultiplePrice TargetProbabilityWeighted Value
Base Case$3.7816x$60.4860%$36.29
Bull Case$3.9018x$70.2025%$17.55
Bear Case$3.6014x$50.4015%$7.56

Probability-Weighted Fair Value: ≈ $61.40
Current Price: $61.29


Dividend & Value Snapshot

FactorSWOTstock Assessment
Dividend Yield~2.6%, well-covered by FCF
Free Cash Flow TrendStrong ($5.2B this quarter)
Dividend Growth HistoryConsistent increases since 2011
Valuation vs. PeersCompetitive vs. IBM, Juniper, and Broadcom
Short-Term UpsideModerate if Splunk execution improves
Downside RiskLimited barring macro deterioration

Peer Comparison Snapshot

CompanyYieldP/E (fwd)Dividend GrowthBalance Sheet Strength
Cisco2.6%~16xConsistentVery Strong
IBM3.4%~15xModestModerate
Juniper2.9%~14xFlatModerate

Entry Strategy – Optional Price Zones

  • Buy Below $58: More favorable value with >3% yield
  • Hold Near $61: Fair value supported by FCF and guidance
  • Trim Above $65: Price may run ahead of fundamentals without improved security results

Verdict

At $61.29, Cisco is fairly valued. It offers:

  • A sustainable 2.6% dividend backed by robust FCF
  • Upside potential tied to AI, Splunk, and enterprise cloud adoption
  • Low downside risk for investors seeking capital preservation and steady income

This isn’t a deep value pick—but it’s a solid hold or add-on-dips candidate for dividend-focused portfolios.


Subscribe for No-Jargon, Real-Earnings Analysis

Get breakdowns tailored to real investors—no jargon, no hype.
Follow @SWOTstock or subscribe to our blog for structured, honest takes on earnings.


Disclaimer

This is not investment advice. All analysis is based solely on Cisco’s official financial report and earnings call transcript. Always do your own due diligence.


Leave a comment

Leave a comment


SoftBank FY2025: Value Play or Value Trap? What Retail Investors Should Know

SoftBank has achieved its first annual profit in four years, posting ¥1.15 trillion for FY2025, driven by Vision Fund 1 gains and an aggressive AI investment strategy. Despite high debt and underperformance from Vision Fund 2, the stock appears undervalued, contingent on the company’s ability to fulfill its ambitious goals.

📊 Quick Take: SoftBank’s Comeback with a Catch

SoftBank (TYO: 9984) just reported its first annual profit in four years, driven by gains in its Vision Fund 1 and a bold AI investment strategy. But Vision Fund 2 is still dragging, and debt remains high. For investors who look at the numbers, the stock looks slightly undervalued—but only if the company delivers on its big promises.


📎 Inside the Numbers: What Drove SoftBank’s FY2025 Profit

SoftBank Group posted a net profit of ¥1.15 trillion for the fiscal year ended March 31, 2025. This was a sharp turnaround from a ¥227.6 billion loss in the previous year. Revenue came in at ¥7.24 trillion, up 7.2% year-over-year, with Vision Fund 1 showing strong gains thanks to holdings like ByteDance and Coupang.

Management emphasized a shift from defense to offense: investing aggressively in AI and semiconductors. That includes a $6.5 billion acquisition of Ampere and plans to invest up to $40 billion in OpenAI via a syndicated structure.

Core segment performance also showed solid growth:

  • Consumer Segment: ¥2,952.9B revenue (+4.6% YoY) — growth in mobile and device sales
  • Enterprise Segment: ¥1,389.4B revenue (+6.8% YoY) — strong digital transformation demand
  • Media & EC: ¥826.1B revenue (+8.4% YoY) — profitability from LY Group
  • Financial Segment: ¥355.4B revenue (+14.4% YoY) — PayPay turned profitable
Table showing SoftBank’s FY2025 revenue by business segment compared to FY2024. Includes Consumer, Enterprise, Media & EC, and Financial segments, highlighting year-over-year growth in billions of yen, with PayPay turning profitable and strong gains in digital services.

Retail investors who like to dig into financials should take note: the company is pivoting hard into high-risk, high-reward territory.

Bar chart comparing SoftBank's revenue by business segment between FY2024 and FY2025, showing year-over-year growth across Consumer, Enterprise, Media & EC, and Financial segments.

✔️ FY2025 Financial Snapshot: Key Metrics

  • Revenue: ¥7.24 trillion (+7.2% YoY)
  • Net Profit: ¥1.15 trillion (vs. ¥-227.6B last year)
  • Operating Income: ¥989 billion (+12.9% YoY)
  • Vision Fund 1: ¥940B gain
  • Vision Fund 2: ¥526B loss
  • Debt: ¥20 trillion gross
  • New Bets: $6.5B Ampere deal, $40B OpenAI initiative
  • Milestone: PayPay turned a profit
Line chart showing SoftBank's quarterly revenue and net income over the past five quarters, highlighting profitability turnaround in FY2025."

🔄 SoftBank SWOT Breakdown: What Matters for the Stock Price

Let’s look at what’s working, what isn’t, what could go right, and what could go wrong.

Horizontal bar chart illustrating estimated stock price impact ranges for SoftBank based on SWOT analysis: strengths (green), weaknesses (yellow), opportunities (blue), and threats (red).

✅ Strengths (Estimated Impact: +¥600 to +¥900/share)

SoftBank’s biggest strength this year is its return to profitability after four years of net losses. The ¥1.15 trillion net income was driven by a rebound in Vision Fund 1, with standout contributions from ByteDance and Coupang. This recovery not only boosts confidence in SoftBank’s asset management capabilities but also reinforces the company’s ability to generate liquidity without resorting to fire-sale asset divestments. Combined with a still-strong balance sheet and monetizable assets like Arm, this foundation supports SoftBank’s ability to take bold bets while weathering downturns. If this profit trend continues and Vision Fund 1 remains stable, the stock could see an upside of ¥600 to ¥900.

❌ Weaknesses (Estimated Impact: –¥400 to –¥700/share)

SoftBank’s structural complexity continues to weigh on investor confidence. Vision Fund 2 posted another ¥526 billion in losses, underscoring ongoing difficulties in picking and scaling private tech companies. Furthermore, SoftBank’s gross debt remains high—hovering around ¥20 trillion—which raises concerns about financial leverage, especially in an uncertain macro environment. Transparency remains a challenge too, with limited visibility into how SoftBank values its private holdings. These factors contribute to a persistent NAV discount and could drag the stock down by ¥400 to ¥700 if not addressed.

🌱 Opportunities (Estimated Impact: +¥500 to +¥800/share)

The company’s aggressive pivot toward AI infrastructure is its most exciting growth lever. Its $6.5 billion acquisition of chip designer Ampere and the $40 billion OpenAI syndicate initiative could position SoftBank as a foundational player in the next generation of AI compute platforms. Additionally, further monetization or appreciation of its Arm stake could catalyze a narrowing of the NAV discount. If these initiatives gain traction—especially if SoftBank manages to translate AI exposure into realized profits—the stock could gain ¥500 to ¥800.

⚠️ Threats (Estimated Impact: –¥300 to –¥600/share)

However, execution risk remains substantial. SoftBank’s exposure to China through holdings like ByteDance continues to invite regulatory and geopolitical scrutiny. A negative revaluation of its private tech holdings—especially in Vision Fund 2—could quickly erode book value. Moreover, AI investments are capital-intensive and long-dated, and success is far from guaranteed. If investor sentiment turns bearish due to underperformance or macro risks, these threats could lead to a ¥300 to ¥600 drop in valuation.

📊 SWOT Summary Table

SWOT analysis summary table for SoftBank FY2025, listing strengths such as profit rebound and Vision Fund 1 gains; weaknesses including Vision Fund 2 losses and high debt; opportunities in AI investments and Arm monetization; and threats like China exposure and tech valuation risk. Each category includes estimated stock price impact ranges in Japanese yen.

📈 SoftBank Valuation Outlook: What the Scenarios Say

🟢 Bull Case – ¥9,000/share (25% probability)

In the most optimistic scenario, SoftBank’s AI strategy delivers early wins: Ampere gains market traction, OpenAI collaboration creates monetizable infrastructure, and the Vision Funds return to consistent profitability. With key portfolio holdings like Arm appreciating further and public market sentiment improving, SoftBank’s NAV discount begins to narrow. If earnings stabilize and the market applies a 0.9x multiple to net asset value (up from the current 0.6x), the stock could reach ¥9,000. This case reflects investor confidence in SoftBank evolving into a key AI ecosystem enabler—and we assign it a 25% probability.

⚪ Base Case – ¥7,800/share (55% probability)

The base case assumes steady execution across SoftBank’s core holdings. Vision Fund 1 remains profitable, and Vision Fund 2 stabilizes but still underperforms. AI investments progress but require time to show returns. The company continues monetizing assets like Arm while maintaining financial discipline. We apply a 0.75x NAV multiple to a stable book value, yielding a target price of ¥7,800. This scenario reflects the most likely trajectory based on current guidance and investment pacing.

🔴 Bear Case – ¥5,900/share (20% probability)

In the downside case, Vision Fund 2 continues to post significant losses, and macro/geopolitical headwinds—particularly China exposure—impact SoftBank’s tech-heavy portfolio. AI investments struggle to gain traction or consume more capital than expected. If NAV contracts and the market applies a more conservative 0.55x multiple, the stock could decline to ¥5,900. While less probable, this scenario reflects the risk of execution delays and external shocks, especially in the global tech sector.

Table outlining SoftBank's FY2025 valuation scenarios: bear case at ¥5,900 with 20% probability, base case at ¥7,800 with 55% probability, and bull case at ¥9,000 with 25% probability. Includes a weighted fair value estimate of ¥7,768 and current stock price of ¥7,132, implying around 9% upside.

🎯 Weighted Probability Valuation

(¥9,000 x 0.25) + (¥7,800 x 0.55) + (¥5,900 x 0.20) = ¥7,768

Current price: ¥7,132 (as of May 13,2025)
Upside: ~+9%


📝 Final Take: Is SoftBank Stock Worth It?

If you trust the numbers and think SoftBank can execute its AI strategy, the stock looks modestly undervalued. But it comes with real risks. This isn’t a set-it-and-forget-it stock—you’ll want to watch each quarter closely.


📢 Stay Ahead: Get More Stock Breakdowns Like This

Want more plain-English stock breakdowns like this? Subscribe now and get the next one before the headlines hit.


⚠️ Disclaimer

This analysis is based only on SoftBank’s official financial report and earnings call. It is not investment advice. Always do your own research before investing.


Leave a comment