

TL;DR – Strong Quarter, Valuation Getting Ahead?
Wells Fargo delivered solid earnings and regulatory clarity in Q2 2025, including the long-awaited removal of its Fed-imposed asset cap. But flat guidance for Net Interest Income (NII) spooked the market. While shares are rebounding, value investors may want to wait for a more attractive margin of safety closer to $76 before entering.
📊 Quarter Recap: Asset Cap Lifted, But NII Dampens Mood
Wells Fargo posted $5.49B in net income (+12% YoY) and $1.60 EPS, beating expectations. Revenue reached $20.82B, with non-interest income showing strength in advisory and trading fees.
However, Net Interest Income (NII) declined 2% YoY, and full-year guidance was trimmed from growth to flat. That change triggered a 5.6% selloff, before shares rebounded.
CEO Charlie Scharf called the quarter a turning point:
“The lifting of the asset cap by the Federal Reserve marked a pivotal milestone in our transformation.”
Wells is now repositioning for growth—especially in fee-based businesses.
🔍 Key Highlights from Q2
- Net Income rose to $5.49B, with EPS at $1.60 (GAAP)
- NII dropped 2% YoY; FY guidance trimmed to flat growth
- Non-interest income strengthened, especially investment banking (+9%)
- Efficiency focus continues with tight expense control
- Asset cap lifted, removing key regulatory hurdle
- Capital return likely to increase—dividend hikes expected post stress test

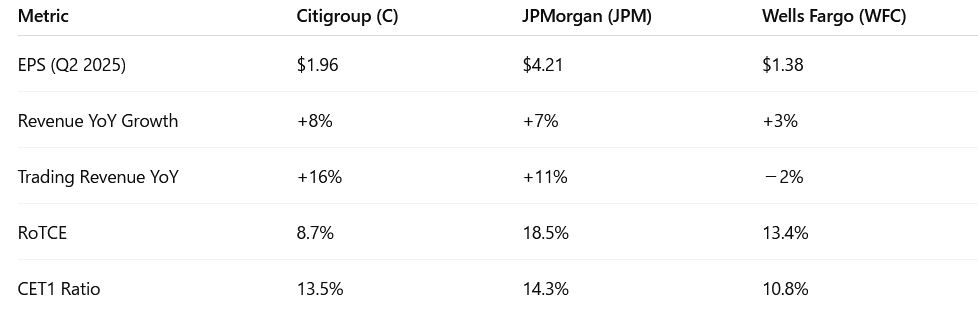
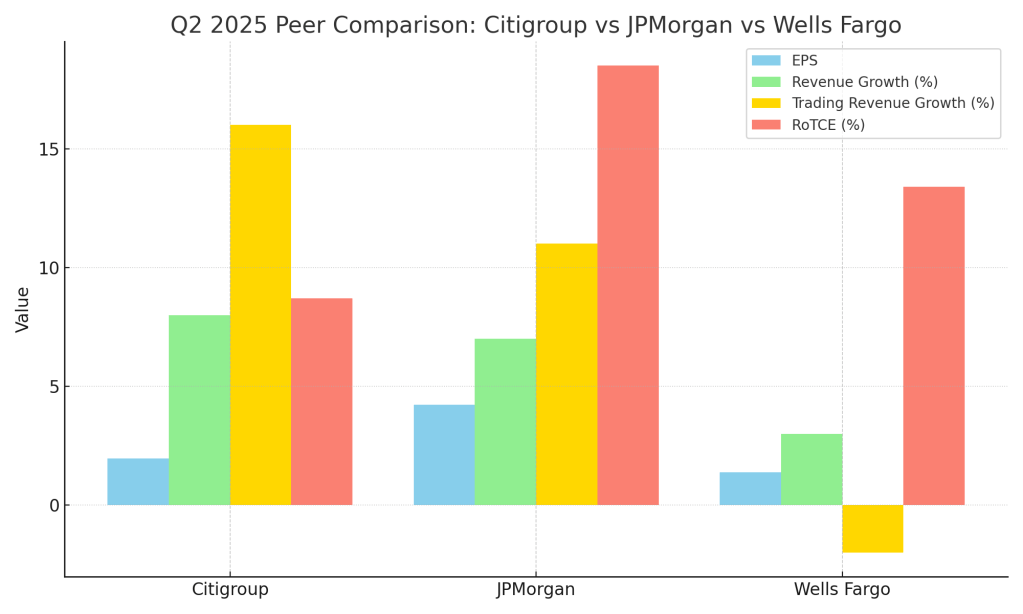
🏦 Peer Context: Wells vs JPMorgan & Citi
- Wells Fargo: Guided for flat NII in FY2025
- Citigroup: Reiterated low single-digit growth
- JPMorgan: Holding NII flat, with cost controls as offset
Wells appears slightly more conservative than peers, raising questions about credit demand and pricing pressure.
💵 Capital Return Outlook: What’s Coming?
Wells Fargo currently yields 1.73%, but management has hinted at capital returns improving post-stress test.
- A 10–12% dividend hike is feasible, which would push the yield toward 1.9–2.0%.
- Share repurchases are also likely to resume more meaningfully in H2 2025.
This return to “normal” capital policy is a key pillar for value-focused investors.
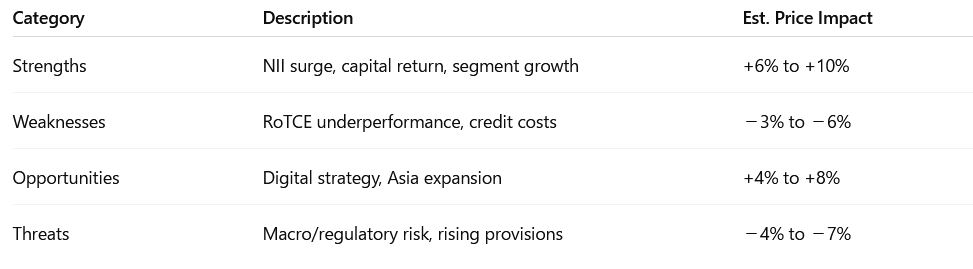
🧭 SWOT Analysis
Wells Fargo’s Q2 2025 performance marks a strategic inflection point—regulatory shackles are gone, fee-based income is recovering, and capital returns are back on the table. But macro uncertainty and cautious NII guidance leave questions about short-term upside. The SWOT analysis below breaks down the bank’s positioning, including estimated price impact for each factor to help value investors frame risk and reward.


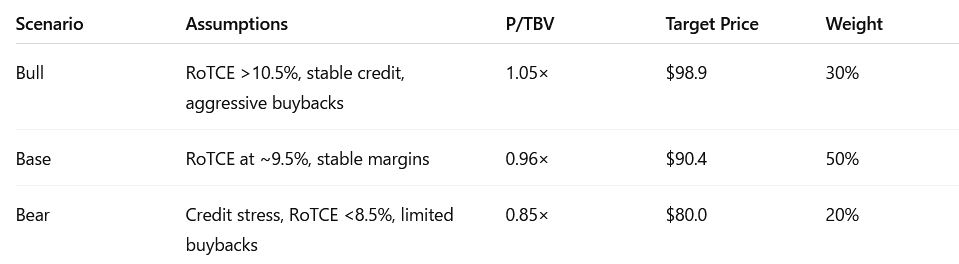
📈 Valuation Scenarios
After evaluating Wells Fargo’s Q2 2025 results, it’s clear that the market has reacted positively to the lifting of the asset cap and stronger capital positioning. However, to determine whether the current share price reflects true value, we turn to the fundamentals. By applying a blended model—based on earnings, book value, and dividend yield—we arrive at a fair value that gives value investors a grounded view of what the stock is really worth.
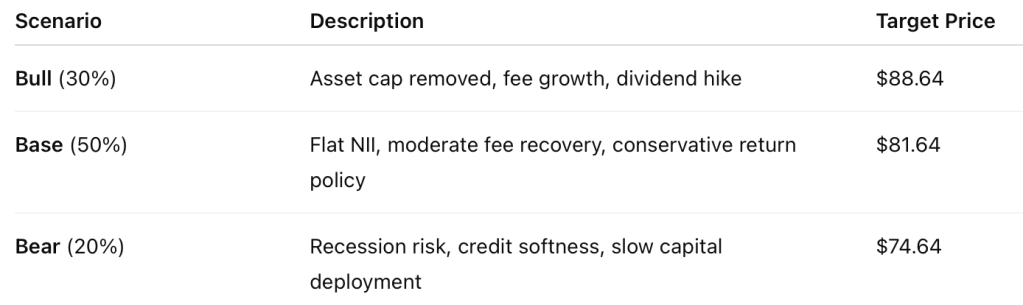
🎯 Probability-Weighted Price Target: $82.30

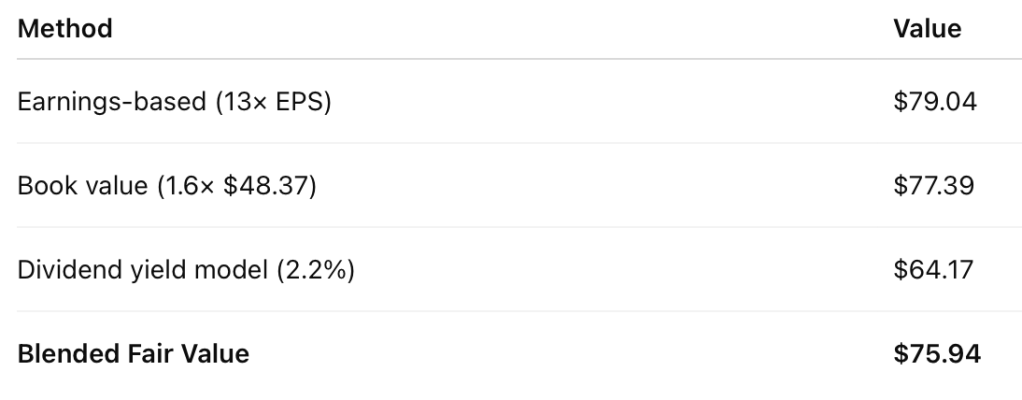
🧮 Fair Value Estimate: Clarity Through the Numbers
We calculate fair value using three methods based on official Q2 2025 data:
🔎 Verdict: Watchlist Candidate, Not Yet a Buy
With the stock currently at $80.64 and our fair value at $75.94, Wells Fargo is trading 5.8% above our estimate.
While long-term upside exists, value investors may want to wait for a pullback toward $74–76 to lock in a proper margin of safety. The market has largely priced in the asset cap news—but not yet the risk of stagnating interest income.
📣 Call to Action
Want to see how Wells Fargo stacks up against JPMorgan and Citi? Check out our recent bank earnings breakdowns and subscribe for alerts on Goldman Sachs, Bank of America, and Morgan Stanley in the days ahead.
🛑 Disclaimer
This blog is for educational and informational purposes only and is not investment advice. All analysis is based solely on official company filings and earnings calls.


Leave a comment