Cisco Q3 FY2025: Dividend Still Solid, Value Emerging — But Is the Splunk Deal a Risk or Reward?

Cisco reported strong Q3 FY2025 results with revenue of $14.15 billion and an EPS of $0.96, beating expectations. The Splunk acquisition offers growth opportunities despite integration risks. The stock is fairly valued at ~$61, providing a 2.6% dividend yield, making it appealing for long-term investors, despite macroeconomic and competitive threats.

Key Takeaways for Income & Value Investors

Cisco (NASDAQ: CSCO) delivered a strong Q3 FY2025, beating expectations and reaffirming its role as a dividend staple. The completed Splunk acquisition adds risk—but also opportunity in cybersecurity and observability. At ~$61, the stock appears fairly valued, with solid yield, modest upside, and limited downside—making it attractive for long-term dividend investors.


Cisco Q3 2025 Earnings Summary

  • Revenue: $14.15 billion (+11% YoY)
  • Non-GAAP EPS: $0.96 (vs. $0.92 guidance)
  • GAAP EPS: $0.62
  • Operating cash flow: $5.2 billion
  • Dividend paid: $1.6 billion
  • Share repurchases: $1.5 billion
  • Free cash flow payout ratio: ~61%
  • Forward dividend yield: ~2.6%
  • Free cash flow yield: ~6.8% (on trailing FCF of ~$15B)
ine chart showing Cisco’s revenue growth and non-GAAP EPS trends over the last five quarters, highlighting consistent financial performance through Q3 FY2025.

Key Highlights This Quarter

  • AI Orders Surge: $600M+ in Q3, exceeding $1B fiscal YTD
  • Capital Return: $3.1B to shareholders (buybacks + dividends)
  • Splunk Acquisition: $28B deal now closed, expanding security + analytics
  • FY2025 Guidance Raised: Modest bump in revenue and earnings outlook
  • CFO Change: Mark Patterson to succeed Scott Herren in July

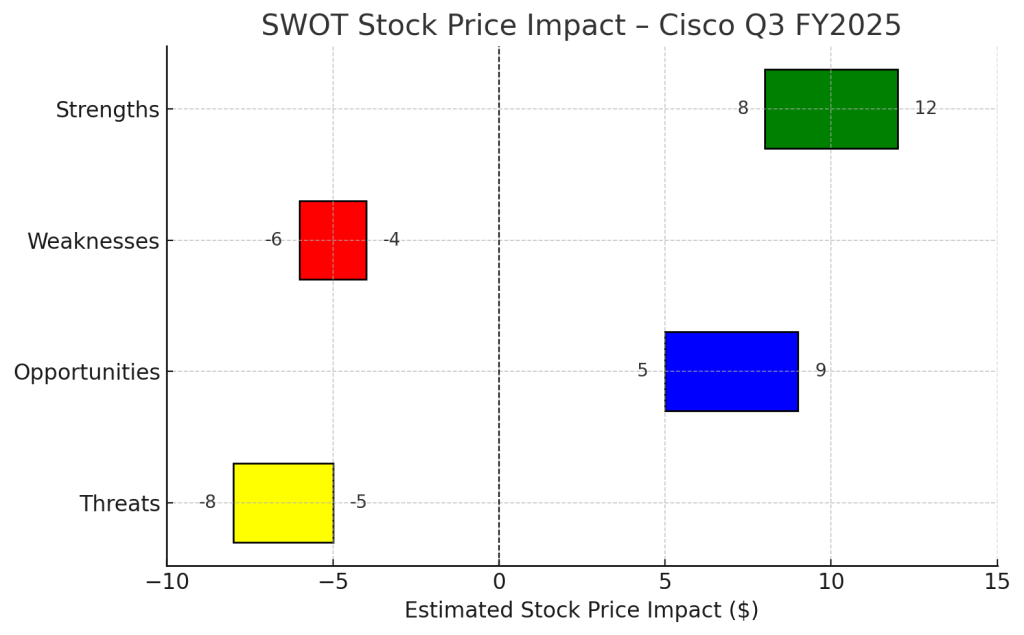
SWOT Analysis (Based on Cisco’s Official Earnings Report & Call)

Strengths

Cisco remains a cash flow powerhouse with predictable returns. It beat guidance, raised full-year forecasts, and maintained a consistent capital return policy. AI orders and secure networking sales accelerated.

Estimated Stock Price Impact: +$8 to +$12

Weaknesses

The security portfolio underperformed, and the integration of Splunk introduces both cultural and execution risks. These could delay synergy realization or weigh on margins short-term.

Estimated Stock Price Impact: –$4 to –$6

Opportunities

Cisco’s software transition, fueled by Splunk, gives it greater recurring revenue potential. Emerging bets like quantum computing and AI-integrated infrastructure add long-term optionality.

Estimated Stock Price Impact: +$5 to +9

Threats

Enterprise IT spending remains vulnerable to macro pressures. Cisco also faces intense competition from hyperscalers and specialized security firms. The CFO transition may cause short-term strategic jitters.

Estimated Stock Price Impact: –$5 to –$8


SWOT Summary Table

SWOT CategoryKey DriverEst. Stock Price Impact
StrengthsEarnings beat, AI orders, dividend reliability+8 to +12
OpportunitiesSoftware shift, Splunk synergy, R&D expansion+5 to +9
WeaknessesSecurity miss, integration risk–4 to –6
ThreatsMacro exposure, competition, leadership change–5 to –8

Horizontal bar chart illustrating Cisco’s estimated stock price impact by SWOT category—Strengths, Weaknesses, Opportunities, and Threats—with clearly labeled ranges.

Cisco Stock Valuation Scenarios Based on FY2025 Guidance

ScenarioEPS (FY25E)P/E MultiplePrice TargetProbabilityWeighted Value
Base Case$3.7816x$60.4860%$36.29
Bull Case$3.9018x$70.2025%$17.55
Bear Case$3.6014x$50.4015%$7.56

Probability-Weighted Fair Value: ≈ $61.40
Current Price: $61.29


Dividend & Value Snapshot

FactorSWOTstock Assessment
Dividend Yield~2.6%, well-covered by FCF
Free Cash Flow TrendStrong ($5.2B this quarter)
Dividend Growth HistoryConsistent increases since 2011
Valuation vs. PeersCompetitive vs. IBM, Juniper, and Broadcom
Short-Term UpsideModerate if Splunk execution improves
Downside RiskLimited barring macro deterioration

Peer Comparison Snapshot

CompanyYieldP/E (fwd)Dividend GrowthBalance Sheet Strength
Cisco2.6%~16xConsistentVery Strong
IBM3.4%~15xModestModerate
Juniper2.9%~14xFlatModerate

Entry Strategy – Optional Price Zones

  • Buy Below $58: More favorable value with >3% yield
  • Hold Near $61: Fair value supported by FCF and guidance
  • Trim Above $65: Price may run ahead of fundamentals without improved security results

Verdict

At $61.29, Cisco is fairly valued. It offers:

  • A sustainable 2.6% dividend backed by robust FCF
  • Upside potential tied to AI, Splunk, and enterprise cloud adoption
  • Low downside risk for investors seeking capital preservation and steady income

This isn’t a deep value pick—but it’s a solid hold or add-on-dips candidate for dividend-focused portfolios.


Subscribe for No-Jargon, Real-Earnings Analysis

Get breakdowns tailored to real investors—no jargon, no hype.
Follow @SWOTstock or subscribe to our blog for structured, honest takes on earnings.


Disclaimer

This is not investment advice. All analysis is based solely on Cisco’s official financial report and earnings call transcript. Always do your own due diligence.


Leave a comment

Leave a comment


Berkshire Hathaway Q1 2025: Patience, Profit, and $189 Billion in Cash

In Q1 2025, Berkshire Hathaway reported a 7.9% decline in operating earnings to $8.48 billion and a substantial $11.2 billion in unrealized losses. However, with $189 billion in cash, the firm remains financially robust. Analysts suggest BRK.B is overvalued, trading around 21.3% above estimated fair value.

Q1 2025 Highlights: What Investors Need to Know

Berkshire Hathaway (NYSE: BRK-A, BRK-B)posted lower operating earnings and unrealized investment losses in Q1 2025, but its balance sheet has never been stronger. With $189 billion in cash and minimal debt, Buffett’s firm is in prime position for future moves—just not in a rush to make them. Despite short-term softness, long-term upside remains, and the stock may be modestly undervalued.


Quarter Recap

In the first quarter of 2025, Berkshire Hathaway reported operating earnings of $8.48 billion, a 7.9% decline year-over-year, reflecting mixed performance across its key segments. Insurance underwriting weakened, GEICO remained under pressure, and BNSF Railway delivered flat results. Meanwhile, investment income benefited from higher interest rates on Treasury holdings.

Buffett and his team remained firm in their philosophy: act only when the odds are overwhelmingly in their favor. Despite a sizable unrealized investment loss of $11.2 billion for the quarter, largely due to equity market fluctuations, they emphasized long-term discipline and capital strength.

One line captures the essence of the quarter: “Better to hold cash than chase risk.”


Key Highlights

  • Operating Earnings: $8.48B (–7.9% YoY)
  • Net Earnings: $(11.2)B (driven by unrealized investment losses)
  • Insurance Underwriting Profit: $1.16B (–19% YoY)
  • Cash and Treasury Holdings: $189B (record high)
  • BNSF Railway Earnings: Flat YoY
  • Interest Income from T-Bills: Estimated $7.5–8B annualized

SWOT Analysis

Let’s break it down using the simple SWOT framework—what’s going well, what’s not, where the upside is, and what risks could derail the story.

Strengths (Estimated Impact: +30 to +50 USD/share)

Berkshire Hathaway’s greatest strength this quarter lies in its unrivaled financial flexibility. With $189 billion in cash and Treasury holdings, minimal debt, and stable earnings from insurance, utilities, and BNSF Railway, the company maintains a defensive yet opportunistic posture. Its insurance float continues to be a low-cost source of funding, while interest income alone now contributes nearly $8 billion annually at minimal risk. This level of capital strength supports a premium valuation multiple and provides built-in downside protection. If investors continue rewarding this structural advantage, these strengths could add $30 to $50 per share to Berkshire’s valuation.

Weaknesses (Estimated Impact: –15 to –20 USD/share)

The downside in this quarter comes from persistent softness in GEICO underwriting, which remains below peer performance despite years of restructuring. Insurance profits fell 19% year-over-year, while BNSF’s earnings were flat due to freight volume stagnation and inflationary pressure. In addition, Berkshire’s manufacturing and retail units—exposed to consumer cyclicality—continue to underwhelm. These underperforming segments may weigh on consolidated earnings growth and investor sentiment, potentially reducing fair value by $15 to $20 per share if they fail to rebound over the next several quarters.

Opportunities (Estimated Impact: +35 to +45 USD/share)

The most compelling upside comes from Berkshire’s ability to deploy capital. With markets remaining volatile, Berkshire is uniquely positioned to act during dislocations. Even without a major acquisition, its Treasury yield is now a legitimate earnings driver, supporting operating income with near-zero risk. In addition, the orderly CEO succession to Greg Abel appears to be progressing well, boosting investor confidence in the post-Buffett era. If Berkshire begins putting even a fraction of its cash to work in high-return assets, and if market sentiment improves around capital efficiency, the stock could gain $35 to $45 per share in valuation upside.

Threats (Estimated Impact: –25 to –30 USD/share)

However, risks remain. Unrealized equity investment losses totaled $11.2 billion in Q1, raising concerns over market volatility and concentration in large holdings like Apple. Succession optics—while stable—still carry narrative risk if markets test Berkshire’s leadership. Moreover, macroeconomic headwinds such as a slowdown in U.S. freight or tighter regulation on insurance operations could strain profitability. If equity markets falter or earnings growth continues to slow, the downside from these threats could weigh $25 to $30 per share on the stock, particularly if investors shift toward faster-growth alternatives.

SWOT Summary


Valuation Scenarios (BRK.B)

Bull Case – $470/share (25% probability)

In the most optimistic scenario, Berkshire deploys a meaningful portion of its $189B cash into high-return investments, insurance underwriting improves across GEICO and reinsurance segments, and its equity portfolio—especially large tech holdings—rebounds strongly. Interest income continues contributing ~$8B annually, lifting operating earnings. If normalized earnings rise and the market awards a 17x multiple (reflecting premium safety and compounding potential), BRK.B could trade at $470. This assumes both smart capital allocation and a favorable macro backdrop, and we assign it a 25% probability.

Base Case – $420/share (60% probability)

The base case assumes Berkshire maintains steady performance: insurance earnings stabilize, BNSF and energy divisions grow modestly, and equity marks remain flat. Interest income boosts baseline earnings, but no major acquisitions occur in the near term. We estimate operating earnings around $35B, applying a conservative 15x multiple in line with historical norms. This results in a $420 valuation. Given Buffett’s cautious stance and consistent fundamentals, we assign this scenario the highest probability at 60%.

Bear Case – $360/share (15% probability)

In the downside scenario, insurance losses persist, equity markets underperform, and Berkshire delays deploying its excess capital, weighing on return on equity. If investment losses continue and operating income weakens due to economic headwinds, the stock could be re-rated at a 12x multiple. This implies a $360 valuation. While Berkshire’s balance sheet offers downside protection, market overreaction or leadership transition sentiment could push shares lower, justifying a 15% probability for this outcome.

Probability-Weighted Valuation

(420 × 0.6) + (470 × 0.25) + (360 × 0.15) = 252 + 117.5 + 54 = $423.50


Verdict: Is BRK.B Overvalued?

  • Current Price (May 9, 2025): $513.74
  • Estimated Fair Value: $423.50

Conclusion:
At ~21.3% above fair value, BRK.B appears overvalued based on company fundamentals and risk-weighted scenarios. The current price reflects investor confidence—but may leave little room for error or near-term upside.


Call to Action

Want simple stock breakdowns like this in your inbox?
Subscribe now and get the next big-name earnings decoded—before the headlines do.


Disclaimer

This post is based solely on Berkshire Hathaway’s official Q1 2025 financial report and shareholder meeting transcript. No third-party commentary or external data was used. This is not investment advice. Please do your own research before making investment decisions.


Leave a comment