Accenture Q2 FY2026 Earnings: Strong AI Demand, But Still Waiting for Growth Acceleration

Accenture reported solid Q2 FY2026 results with record bookings of $22.1 billion and raised its revenue growth guidance to 4–7%. However, revenue growth remains mid-single digits, and GAAP margins compressed. The stock price is near its fair value, with future performance dependent on executing AI strategies rather than just demand narratives.

TL;DR Summary

Accenture (ACN:NYSE) delivered a solid quarter with record bookings and raised guidance, confirming strong enterprise AI demand. However, revenue growth remains in the mid-single digits, and margin pressure suggests AI investments are still in the build phase. The stock is trading close to its probability-weighted fair value, meaning future upside depends on execution—not narrative.


Quarter Recap

Accenture reported Q2 FY2026 results that reflect strong execution but measured growth. Revenue reached $18.0 billion, growing 7% in U.S. dollars and 4% in local currency. Adjusted EPS came in at $3.59, up 10% year over year, while GAAP EPS declined 4%.

The most notable metric was bookings, which hit a record $22.1 billion for a second quarter, indicating strong forward demand. The company also raised its full-year revenue growth guidance to 4–7%, reinforcing confidence in its pipeline.

However, margin trends were mixed. Adjusted operating margin improved slightly, but GAAP margins declined, reflecting continued investment in AI capabilities.


Key Highlights

  • Revenue: $18.0B (+7% USD, +4% local currency)
  • Adjusted EPS: $3.59 (+10% YoY)
  • GAAP EPS: $3.19 (-4% YoY)
  • Record bookings: $22.1B
  • Raised FY2026 revenue growth guidance: 4–7%
  • Free cash flow: $2.68B
  • Share repurchases: $1.7B
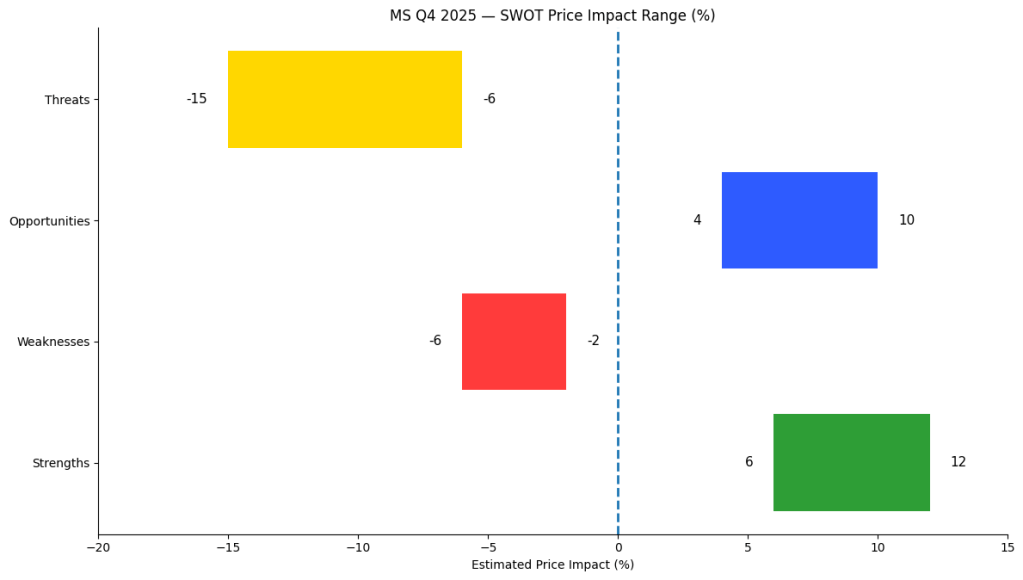
SWOT Analysis

Accenture’s results reinforce its position as a high-quality execution platform for enterprise transformation and AI adoption. The company is seeing strong demand and improving visibility, but the market is still waiting for clear evidence that this demand can translate into sustained revenue acceleration and margin expansion.
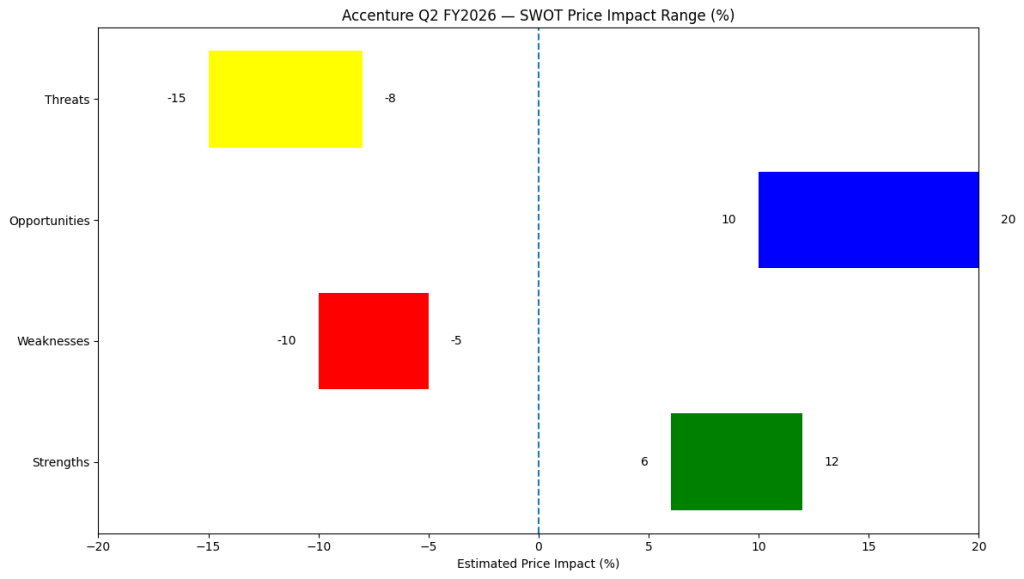

Strengths

  • Record bookings ($22.1B) → strong forward revenue visibilityEstimated impact: +6% to +10%
  • Raised FY2026 guidance (4–7%) → improving confidenceEstimated impact: +4% to +7%
  • Balanced model (Consulting + Managed Services)Estimated impact: +3% to +6%
  • Positioned as enterprise AI orchestrator across ecosystemsEstimated impact: +5% to +12% (long-term)

Weaknesses

  • Revenue growth still mid-single digit (4% local currency)Estimated impact: -5% to -10%
  • GAAP margin compression (-70bps)Estimated impact: -3% to -6%
  • GAAP EPS decline (-4% YoY)Estimated impact: -3% to -5%

Opportunities

  • AI bookings converting into revenue accelerationEstimated impact: +10% to +20%
  • Early-stage enterprise AI adoption cycleEstimated impact: +8% to +15%
  • Large deal momentum (41 clients >$100M bookings)Estimated impact: +5% to +10%

Threats

  • AI commoditization (clients internalizing capabilities)Estimated impact: -8% to -15%
  • Hyperscalers capturing more value chainEstimated impact: -5% to -12%
  • Macro-driven IT spending volatilityEstimated impact: -6% to -10%
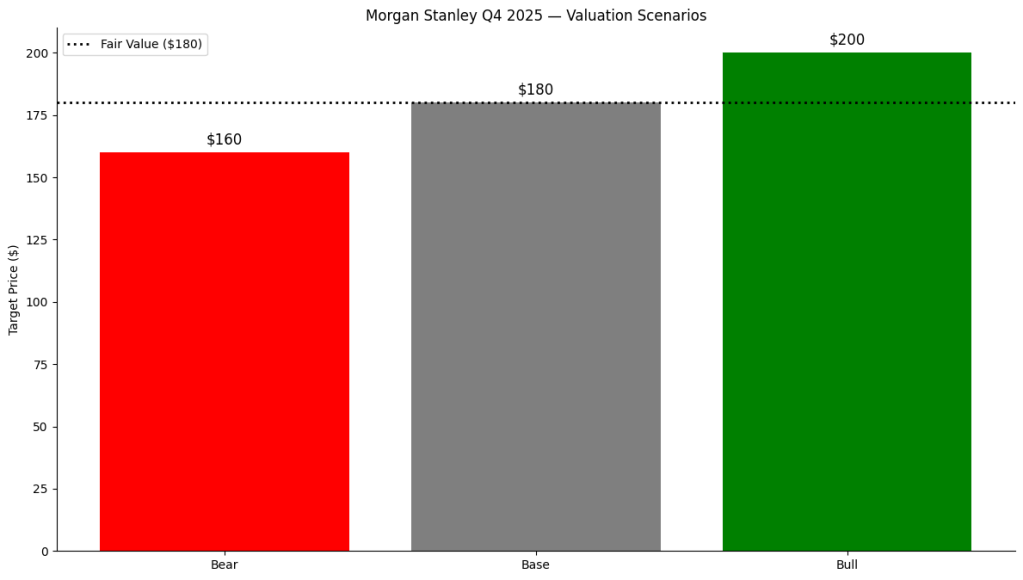
Horizontal SWOT chart showing Accenture Q2 FY2026 estimated stock price impact ranges, with strengths and opportunities in positive territory and weaknesses and threats in negative ranges on a -20% to +20% scale.
SWOT price impact ranges for Accenture’s Q2 FY2026 earnings, highlighting the balance between strong AI-driven demand and ongoing growth and margin constraints.

Valuation Scenarios

Accenture is currently being valued as a stable, high-quality operator with AI exposure, but not yet as a high-growth AI beneficiary. The key variable remains whether strong bookings can translate into sustained revenue acceleration.


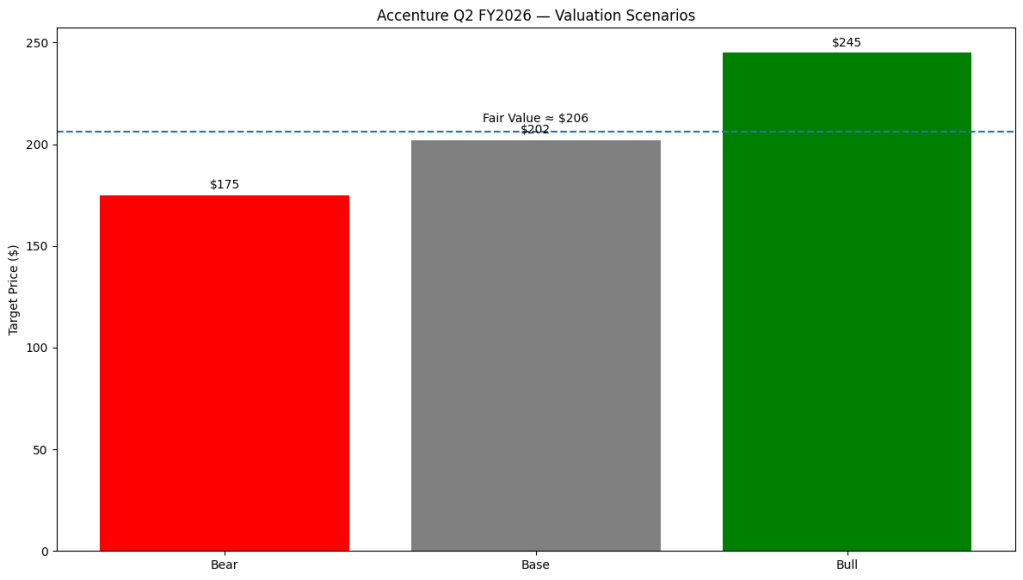
Bear Case — $170 to $180

If revenue growth remains around 4–5% and AI demand takes longer to convert into revenue, while margins remain under pressure, the stock could see multiple compression toward traditional consulting peers.


Base Case — $195 to $210

If Accenture delivers within its updated 4–7% growth guidance and AI contributes incrementally without significantly accelerating growth, the stock is likely to remain around current levels with modest upside.


Bull Case — $230 to $260

If AI bookings translate into revenue acceleration above 8–10% and margins expand through operating leverage, Accenture could be re-rated as a leading AI execution platform.


Probability-weighted fair value

Based on the scenario analysis:

  • Bear case (25%): ~$175
  • Base case (50%): ~$202
  • Bull case (25%): ~$245

👉 Estimated fair value: ~$206

At a current price of around $203, Accenture is trading very close to its probability-weighted fair value, suggesting that the market is already pricing in its current level of execution.

Bar chart showing Accenture Q2 FY2026 valuation scenarios with bear case at $175, base case at $202, and bull case at $245, including a dashed fair value line at approximately $206.
Accenture Q2 FY2026 valuation scenarios showing bear, base, and bull price targets, with a probability-weighted fair value of approximately $206 based on execution and AI growth assumptions.

Verdict

Accenture continues to execute well, supported by strong demand and improving guidance. However, the market is still waiting for clear evidence that AI demand can drive sustained revenue acceleration.

At current levels, the stock appears fairly valued. This shifts the investment case from valuation-driven upside to execution-driven upside.

For now, Accenture remains a “show-me” story—a high-quality compounder with AI optionality, but not yet a full AI re-rating.


Call to Action

If you want more breakdowns like this—focused on how earnings translate into real price impact—follow SWOTstock for SWOT analysis on major companies.


Disclaimer

This analysis is for informational purposes only and does not constitute financial advice. Always conduct your own research before making investment decisions.


Morgan Stanley Q4 2025 Earnings: Investment Banking Is Back, but Is the Stock Fully Priced?

Morgan Stanley’s Q4 2025 earnings surpassed expectations, driven by investment banking recovery and stable wealth management. The firm achieved record profits, with an estimated fair value of $180 per share, indicating limited upside post-rally. Despite strengths in diversified revenue, the stock appears fairly valued against market risks and economic conditions.

TL;DR Summary

  • Morgan Stanley (MS:NYSE) delivered a strong Q4 2025, driven by a sharp rebound in investment banking and steady wealth management growth.
  • Full-year profitability and returns remain well above cost of capital, reinforcing MS as a high-quality franchise.
  • However, after a post-earnings rally, the stock looks close to fair value rather than clearly cheap.
  • Fair value estimate: around $180 per share, implying limited upside at current levels unless the deal cycle stays strong.

Quarter Recap

Morgan Stanley reported Q4 2025 results that clearly exceeded market expectations. Net revenues rose meaningfully year-over-year, with earnings boosted by a recovery in advisory and underwriting activity. Wealth Management continued to provide a stable backbone, while Institutional Securities re-accelerated as capital markets activity improved into year-end.

The earnings release confirmed that FY2025 was a record year for the firm in terms of revenues and earnings, validating the long-term strategy of building a more balanced, fee-driven business alongside cyclical market activities.


Key Highlights

  • Q4 net revenues: $17.9B, up solidly year-over-year
  • Q4 EPS: $2.68
  • FY2025 EPS: $10.21 (record)
  • ROTCE: ~22%, firmly above historical averages
  • CET1 capital ratio: ~15%, supporting dividends and buybacks
  • Wealth Management revenues: $8.4B in Q4, reflecting durable fee income
  • Investment Banking revenues: sharply higher year-over-year, signaling a deal-cycle rebound

SWOT Analysis

Morgan Stanley’s Q4 results highlight the strength of its integrated model: a resilient wealth management base combined with cyclical upside from investment banking. The following SWOT translates these drivers into estimated valuation impacts.

Strengths

  • High-quality earnings power and profitability driven by diversified businesses and ~22% ROTCE. (Estimated impact: +6% to +12%)
  • Wealth Management scale and stickiness, with large fee-based assets providing earnings stability. (+5% to +10%)
  • Clear rebound in investment banking, supporting upside to normalized earnings. (+4% to +9%)
  • Strong capital position (CET1 ~15%), enabling consistent capital returns. (+2% to +5%)

Weakness

  • Earnings remain market-sensitive, particularly in trading and underwriting. (−2% to −6%)
  • Rising technology and execution costs, which could pressure margins if they become structural. (−2% to −5%)
  • Isolated credit noise, including CRE-related charge-offs, reminds investors of tail risks. (−1% to −3%)

Opportunities

  • Sustained deal-cycle recovery could keep Institutional Securities returns elevated. (+4% to +10%)
  • Further shift toward fee-based wealth revenues enhances durability and valuation quality. (+3% to +8%)
  • Operating leverage, as incremental revenues flow through at higher margins. (+2% to +6%)

Threats

  • A reversal in capital markets sentiment could quickly compress revenues and multiples. (−6% to −15%)
  • Regulatory or capital rule changes that reduce returns on equity. (−3% to −8%)
  • Cost inflation becoming structural, limiting valuation re-rating. (−2% to −7%)
SWOT price impact chart for Morgan Stanley Q4 2025, illustrating strengths, weaknesses, opportunities, and threats with estimated share price impact ranges from −20% to +15%.
Morgan Stanley Q4 2025 SWOT analysis showing estimated price impact ranges. Strengths and opportunities reflect investment banking recovery and wealth management durability, while weaknesses and threats capture market cyclicality and downside risks.

Valuation Scenarios

For Morgan Stanley, valuation is best anchored on tangible book value and returns on equity. With tangible book value per share around $50, different P/TBV multiples reflect how much premium the market assigns to a ~20%+ ROTCE franchise.

Bear case (~$160)

  • Deal activity cools and market conditions soften.
  • Valuation compresses toward a more conservative quality-bank multiple.

Base case (~$180)

  • Wealth Management remains stable and investment banking normalizes.
  • MS sustains premium returns without further multiple expansion.

Bull case (~$200)

  • Deal momentum persists and the integrated-firm narrative strengthens.
    • Market assigns a top-tier multiple to durable earnings power.

Probability-weighted fair value: ~$180 per share.

Valuation scenarios chart for Morgan Stanley Q4 2025 with three bars showing bear case at $160, base case at $180, and bull case at $200, alongside a dotted fair value line at $180.
Morgan Stanley Q4 2025 valuation scenarios showing bear, base, and bull price targets. The probability-weighted fair value centers around $180 per share, highlighting limited upside after the post-earnings rally.

Verdict

Morgan Stanley remains a best-in-class financial franchise, and Q4 2025 confirms that its diversified model works when markets recover. However, after the post-earnings rally, the stock appears fairly valued rather than obviously undervalued.

For long-term, value-oriented investors:

  • Above ~$190: upside looks limited unless the deal cycle stays unusually strong.
  • Around ~$180: valuation is reasonable for a high-quality compounder.
  • Below ~$165: the stock would begin to offer a more compelling margin of safety.

Call to Action

If you found this breakdown useful, follow SWOTstock for clear, fundamentals-driven earnings analysis that cuts through the noise and focuses on valuation, risk, and long-term returns.


Disclaimer

This article is for informational purposes only and does not constitute investment advice. All analysis is based on publicly available company disclosures. Investors should conduct their own research or consult a financial professional before making investment decisions.


Wells Fargo Q4 2025 Earnings — Capital Returns Doing the Work, Not Growth

Wells Fargo’s Q4 2025 results indicate a shift from turnaround efforts to stable, capital-driven profitability, with earnings exceeding expectations. However, concerns over declining net interest income suggest limited growth potential. Capital returns remain strong, but macro conditions will dictate future valuation. The stock is currently a hold for cautious investors.

TL;DR Summary

Wells Fargo’s (WFC:NYSE) Q4 2025 results confirmed that the bank has largely exited its turnaround phase and entered a period of normalized, capital-driven value creation. Earnings exceeded expectations, profitability targets were raised, and shareholder returns accelerated meaningfully. However, softer net interest income guidance underscored that earnings growth will remain constrained by the rate environment. At around the high-$80s per share, the stock appears fairly valued with modest upside, driven primarily by buybacks rather than revenue momentum. Wells Fargo is no longer repairing — but it is also not re-rating aggressively yet.


Quarter Recap

Wells Fargo reported Q4 2025 earnings that reinforced the durability of its earnings base while clarifying the limits of near-term growth. Results benefited from continued cost discipline and strong capital deployment, allowing the bank to deliver an earnings beat despite a more challenging net interest income backdrop.

Management used the quarter to recalibrate investor expectations. While acknowledging ongoing pressure on net interest income, leadership emphasized that Wells Fargo has now achieved sufficient operational and regulatory stability to focus on normalized profitability and shareholder returns. The quarter marked a shift away from remediation narratives toward disciplined capital allocation, even as the pace of earnings expansion remains tied to macro conditions.


Key Highlights

  • Management raised its medium-term ROTCE target to 17–18%, signaling confidence in sustainable profitability
  • FY2025 capital returns of approximately $23B, including ~$18B in share buybacks
  • Net interest income declined, with forward guidance indicating continued pressure into 2026
  • Credit performance remained stable, with no material deterioration in asset quality
  • Capital ratios stayed comfortably above regulatory requirements, preserving flexibility

SWOT Analysis

Wells Fargo’s Q4 results reinforce a clear conclusion: the investment case is no longer about fixing the franchise, but about how much value can be created through capital returns in a constrained growth environment.

Strengths

Wells Fargo’s improving profitability profile and aggressive capital return program now anchor the equity story. The decision to raise the ROTCE target reflects confidence that the bank’s earnings power is structurally higher than in prior cycles. Large-scale buybacks at or near intrinsic value materially enhance per-share value and provide downside support even in a slow-growth scenario. Balance-sheet strength and disciplined risk management further reinforce earnings durability.

Estimated price impact: +8% to +12%


Weaknesses

Net interest income remains under pressure as asset yields reset faster than deposit costs can adjust, limiting operating leverage. While cost controls have improved, revenue growth remains heavily rate-dependent, constraining near-term upside. The reliance on capital returns rather than organic growth also caps the stock’s re-rating potential in the absence of a more favorable rate backdrop.

Estimated price impact: −6% to −10%


Opportunities

Sustained execution toward the newly raised ROTCE target could gradually improve investor confidence and support modest multiple expansion. Continued buybacks represent a powerful compounding mechanism, particularly if shares remain priced near intrinsic value. Incremental recovery in fee-based businesses, including wealth and card services, offers optional upside not fully reflected in current expectations.

Estimated price impact: +7% to +12%


Threats

The primary risks remain macro-driven. Faster-than-expected rate cuts would extend net interest income pressure, delaying earnings normalization. A material economic slowdown could push credit costs higher, overwhelming incremental efficiency gains. Regulatory intervention also remains a structural risk, even if less acute than in prior years.

Estimated price impact: −7% to −14%

Capital returns and profitability targets drive upside, while net interest income pressure and macro risks cap near-term re-rating.

Valuation Scenarios

Wells Fargo is best valued using a normalized profitability and capital-return framework, rather than quarter-to-quarter earnings volatility. The scenarios below illustrate how different macro and execution paths could shape valuation outcomes.

Bear Scenario

This scenario assumes prolonged net interest income pressure combined with rising credit costs, limiting earnings growth and keeping valuation anchored near historical lows.

  • Assumptions: Continued NII decline into 2026; higher credit costs; slower buyback pace
  • Implied value: ~$70–75

Base Scenario

This reflects the current market consensus: net interest income stabilizes, credit remains well-behaved, and capital returns continue at scale.

  • Assumptions: Mid-to-high-teens ROTCE; stable credit; sustained buybacks
  • Implied value: ~$88–95

Bull Scenario

This scenario assumes a more supportive rate environment, fee income recovery, and faster progress toward profitability targets, enabling modest multiple expansion.

  • Assumptions: NII stabilization; strong capital returns; gradual re-rating
  • Implied value: ~$105–110

Probability-Weighted Fair Value

Across scenarios, Wells Fargo’s fair value clusters around:

~$90–95 per share

Valuation scenarios bar chart for Wells Fargo Q4 2025 showing three price targets: Bear case around $73, Base case around $92, and Bull case around $108, with a dotted horizontal line indicating a fair value near $92.
Base-case valuation centers on normalized earnings and sustained capital returns, while upside depends on fee recovery and rate stabilization rather than near-term growth acceleration.

Verdict

Wells Fargo has decisively moved beyond its remediation phase, but it has not yet entered a clear growth-driven re-rating regime. Q4 confirmed improved earnings quality, strong capital returns, and rising profitability targets, yet the stock remains constrained by net interest income headwinds and macro uncertainty.

At current levels, Wells Fargo is best viewed as a hold or incremental accumulate for DIY value investors. The return profile is attractive, but it is driven by capital discipline and patience, not acceleration. The upside case exists — but it will take time.


Call to Action

If you own Wells Fargo, the key question is no longer whether the bank is fixed — that question has largely been answered. The real issue is whether capital returns and normalized profitability can compound value while investors wait for the rate cycle to turn. For valuation-aware investors building durable portfolios, Wells Fargo remains relevant — but not urgent.


Disclaimer

This analysis is for informational purposes only and does not constitute investment advice. Always conduct your own research and consider your financial situation before making investment decisions.