Is McDonald’s Still Worth the Premium? A Deep Dive into Q1 2025 Earnings

McDonald’s Q1 2025 earnings revealed a mixed performance, with total revenue at $5.96 billion, down 2% year-over-year. U.S. sales fell 3.6%, but global sales rose 1.9%. While profitability remained stable with EPS at $2.66, investor concerns over U.S. weakness led to a 1.9% stock decline. Analysts suggest the stock may be overpriced.

McDonald’s (NYSE: MCD) just released its earnings for the first quarter of 2025 on May 1, 2025, and the market had a mixed reaction. While global growth remained steady, softness in the U.S. weighed on investor sentiment. In this post, we’ll break down what happened this quarter, summarize the key highlights, provide a structured SWOT analysis, and assess whether the current stock price is justified—or a bit ahead of itself.


Q1 2025 Recap: A Mixed Meal

McDonald’s reported total revenue of $5.96 billion, down 2% year-over-year, falling short of expectations. The main drag? U.S. comparable sales declined 3.6%, driven by reduced traffic among low-income consumers. This came as a surprise, especially given the resilience shown in prior quarters.

On the bright side, global comparable sales rose 1.9%, with particularly strong performance in International Developmental Licensed Markets. The company’s digital flywheel continues to expand, now boasting over 170 million 90-day active users and generating $30 billion in annual systemwide sales.

Profitability held steady. EPS came in at $2.66, flat compared to last year, and the company maintained its full-year guidance, signaling long-term confidence.

Still, investors punished the stock on release day, driving it down by –1.9%, reflecting concern about core market softness.


Quarter Summary – Key Highlights

  • Revenue: $5.96B (–2% YoY), below consensus
  • EPS: $2.66 (flat YoY)
  • U.S. Comparable Sales: –3.6% (unexpected contraction)
  • Global Comparable Sales: +1.9%
  • Digital Engagement: 170M+ active loyalty users; $30B in system sales
  • Store Growth: Targeting 2,200 new units globally in 2025
  • Guidance: Unchanged; long-term growth remains intact
  • Stock reaction: –1.9% on earnings day

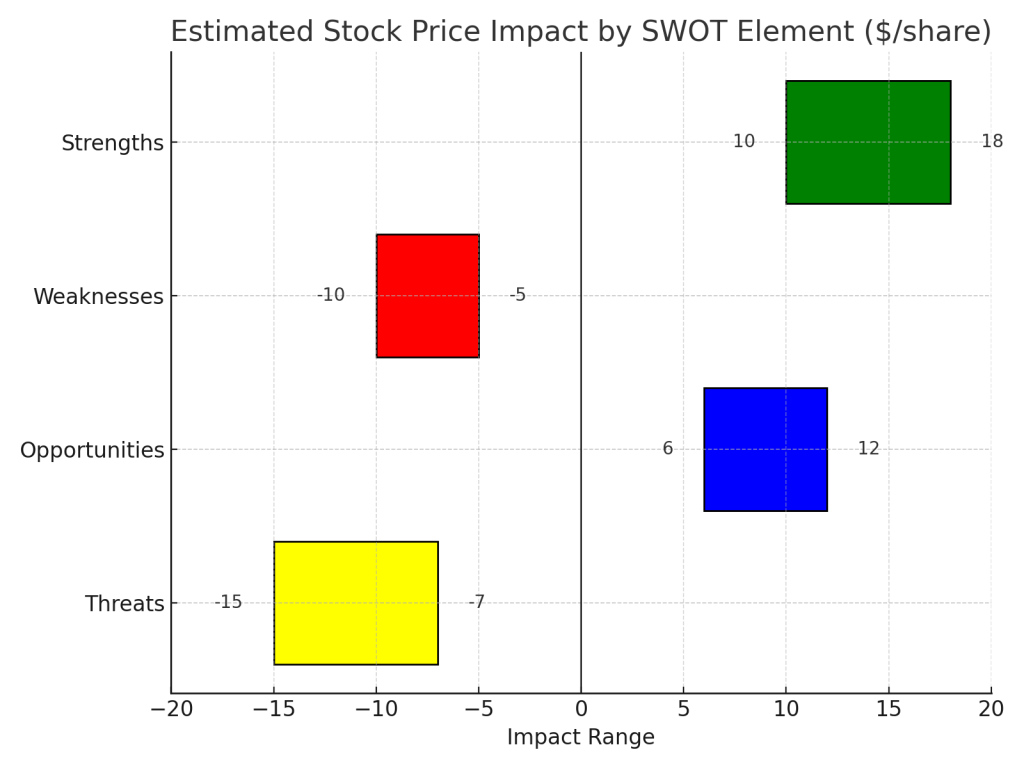
SWOT Analysis with Quantitative Stock Price Impact

Now that we’ve covered the surface, let’s dive deeper. A SWOT analysis gives us a structured way to assess the quarter’s real implications—including how each element likely impacted the stock price.

Strengths

McDonald’s international operations continue to deliver. The 1.9% global comparable sales growth helped soften the blow from weak U.S. performance. In addition, the company’s digital ecosystem is a major asset. With 170M+ loyalty users contributing to $30B in sales, this customer retention engine is likely to support long-term revenue stability.

Stock impact: These strengths contributed to a +1.0% to +1.7% positive pressure on the stock price.

Weaknesses

The glaring weakness this quarter was the –3.6% decline in U.S. comparable sales, reflecting a pullback in visits from lower-income consumers. Management acknowledged that value offerings weren’t enough to fully retain traffic. Flat EPS ($2.66) also showed that margin strength couldn’t offset volume weakness.

Stock impact: Weaknesses contributed to a –1.8% to –2.7% downward adjustment.

Opportunities

McDonald’s sees opportunity in its global expansion plans, with 2,200 new store openings planned this year (including 1,000 in China). Value menu strategies, like a €4 Happy Meal in Germany, are also being deployed to retain budget-conscious customers.

Stock impact: These growth signals added +0.5% to +1.0% upside potential.

Threats

Consumer sensitivity to inflation, especially among low-income groups, poses a real threat to short-term performance. Additionally, competitive pressure in Europe, especially the UK, remains elevated and was acknowledged by management on the call.

Stock impact: Threats exerted –0.7% to –1.2% negative pressure.

Net Stock Impact Estimate: Combining all elements, the stock saw a net estimated drop of –0.8% to –1.2%, which aligns closely with the actual decline of –1.9% post-earnings.


SWOT Summary

SWOT Analysis – Q1 2025
Strengths
• Digital loyalty program scaling globally
• $30B in digital systemwide sales
• Global comparable sales +1.9%
Stock impact: +1.0% to +1.7%
Weaknesses
• U.S. comparable sales –3.6%
• Soft traffic among low-income groups
• Flat EPS YoY
Stock impact: –1.8% to –2.7%
Opportunities
• 2,200 store openings in 2025
• Strong growth in China
• Value-based pricing in Europe
Stock impact: +0.5% to +1.0%
Threats
• Rising price sensitivity
• Competitive pressure in key markets
• Inflation could impact margin recovery
Stock impact: –0.7% to –1.2%

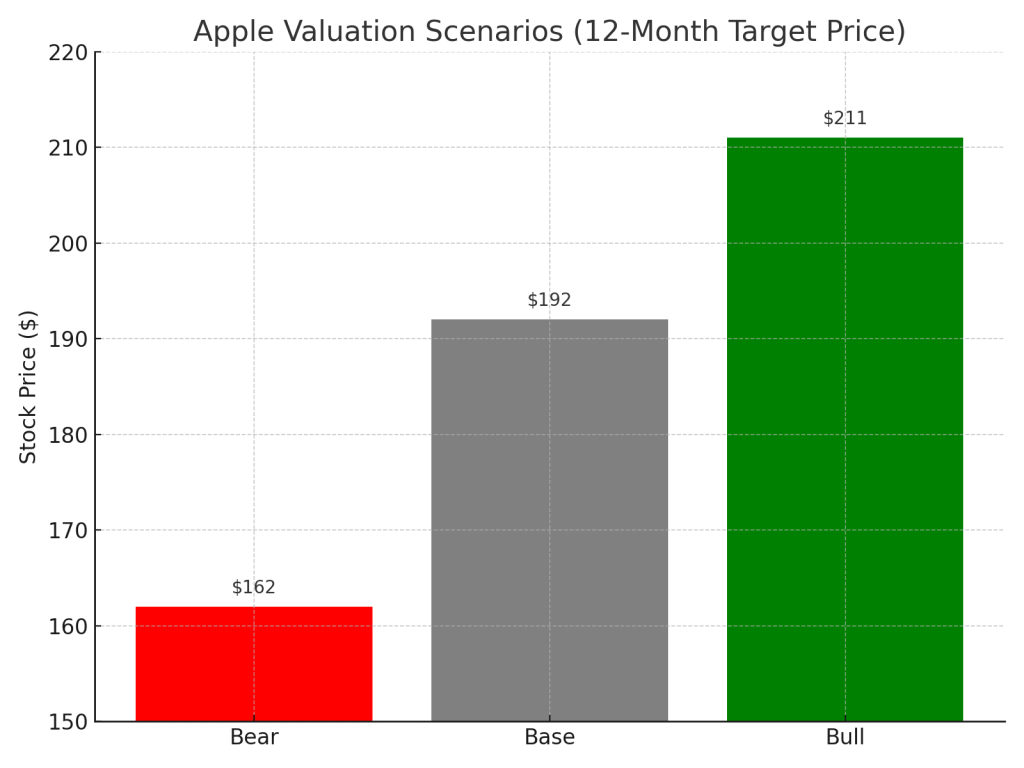
Base, Bull, and Bear Cases

Let’s now examine where McDonald’s stock could go from here, using base, bull, and bear cases based on the earnings report.

ScenarioNarrativeStock Price EstimateProbability
Base CaseBalanced view: EPS flat, U.S. weak, digital stable$310.67 (–1.2%)60%
Bull CaseFocus on digital loyalty, global expansion offsets U.S. drag$317.56 (+1.0%)25%
Bear CaseMarket reacts strongly to U.S. weakness and low-income trends$304.00 (–3.0%)15%

Expected Value:
= $314.42 × (1 – 0.0092) = $311.52

With the actual current price at $308.42 (May 2, 2025), the market is leaning more pessimistic than our weighted scenario suggests.


Valuation: Is the Stock Fairly Priced?

McDonald’s is currently trading at a P/E ratio of ~27.15×, which is slightly above its 5-year historical range of 23×–26×. With no earnings growth and U.S. comps turning negative, the fundamentals suggest that a 25× multiple is more appropriate, implying a fair value around $284.

MetricValue
Current Price$308.42
Fair Value (Base Case)$284
Premium to Fair Value+8.6%
VerdictOverpriced by ~8–10%

Final Take

McDonald’s remains a strong global brand with a powerful digital strategy, but the U.S. consumer softness and flat profitability raise questions about near-term growth. While long-term investors may look past these issues, at today’s price, the stock appears to be slightly overpriced relative to its fundamentals.

If you’re holding, stay patient—but if you’re considering buying, it may be worth waiting for a better entry point.


Comment on Source Usage:
This analysis is based exclusively on McDonald’s official Q1 2025 financial report and the corresponding earnings call transcript. No third-party news articles, analyst opinions, or external data sources were referenced. This approach ensures the insights presented reflect only the company’s own disclosures and strategic messaging.

Disclaimer:
This content is for informational purposes only and does not constitute financial advice, investment recommendations, or an endorsement to buy or sell any securities. Readers should conduct their own research or consult a qualified financial advisor before making investment decisions.


Please subscribe to our blog for the latest analysis. If you want a detailed full analysis report, please leave a comment.


Leave a comment

Microsoft Q3 FY25: Strong AI Momentum, But Is the Stock Already Fully Priced?

Microsoft’s Q3 FY25 earnings beat expectations with strong Azure and AI growth. This in-depth analysis includes key highlights, SWOT breakdown, and stock valuation scenarios to help investors decide if MSFT is a buy, hold, or overvalued. Based only on official financials and earnings call.

Quick Take: Microsoft’s Q3 FY25 at a Glance

Microsoft’s Q3 FY25 earnings beat expectations across the board, driven by Azure’s 23% growth and rising Copilot adoption. Margins expanded, and management sounded confident about long-term AI monetization. But with the stock trading at $435, much of that optimism may already be priced in. Our analysis suggests the stock is fairly valued with limited upside unless Copilot monetization accelerates further.


Quarter Recap

Microsoft reported another strong quarter, with revenue reaching $70.1 billion, up 13% year-over-year. Net income rose 18% to $25.8 billion, and EPS hit $3.46—up 18% from last year. The standout performer was Azure, which grew 23% in constant currency, with about 16 percentage points attributed to AI-related services.

CEO Satya Nadella emphasized “material AI usage revenue” and confirmed that Copilot adoption is broadening across Microsoft 365, GitHub, and Dynamics. Despite ramping up AI infrastructure investments (CapEx of $14 billion this quarter), Microsoft maintained strong operating margins at 46%.

This quarter matters because it signals that Microsoft is not just leading in AI hype—it’s beginning to turn that momentum into revenue and margin growth.


Key Highlights

  • Revenue: $70.1B (+13% YoY)
  • Net Income: $25.8B (+18% YoY)
  • EPS: $3.46
  • Azure Growth: +23% YoY (16 pts from AI)
  • Operating Margin: 46%
  • Microsoft 365 Commercial Revenue: +12%
  • CapEx: $14B
  • Free Cash Flow: $20.3B
  • RPO (future revenue backlog): $315B (+34% YoY)

SWOT Analysis: What’s Behind the Numbers

Let’s break it down using the simple SWOT framework—what’s going well, what’s not, where the upside is, and what risks could derail the story.


Strengths

Microsoft’s cloud and AI strategy is clearly working. Azure’s 23% growth—with AI workloads driving more than half that—shows early returns on heavy AI investments. Commercial bookings and RPO (future revenue) are growing fast, and the company has scaled its margin even while expanding CapEx.

Estimated stock impact: If sustained, these results could support a +$20–30/share uplift in fair value.


Weaknesses

The More Personal Computing segment is still sluggish. Windows OEM and Surface revenue posted modest gains (3–5%), and Copilot monetization—while promising—is still early. Some segments may weigh on overall revenue growth if cloud doesn’t continue to outperform.

Estimated impact: A drag on future growth could shave –$5 to –$10/share off fair value.


Opportunities

The biggest upside? AI monetization. Microsoft is embedding Copilot across every product—Office, GitHub, Dynamics—and that creates an enormous paid seat opportunity. With 430M Microsoft 365 commercial seats, even modest Copilot adoption could unlock billions in new revenue.

Estimated impact: If realized at scale, this could add +$30–50/share to valuation over time.


Threats

Valuation is the elephant in the room. Microsoft is trading at 33x forward earnings—well above its 10-year average of 26x. That’s a premium for perfection. If AI adoption underwhelms or regulation slows the rollout, the stock could de-rate quickly.

Estimated downside: In a bearish scenario, risks could cut –$40–60/share off the stock.


SWOT Summary Table

CategoryHighlightsEst. Price Impact
StrengthsAzure + AI growth, strong margins+$20–30
WeaknessesPC revenue lag, early-stage Copilot monetization–$5 to –$10
OpportunitiesAI monetization across Microsoft ecosystem+$30–50
ThreatsRich valuation, regulatory headwinds–$40–60

Valuation Scenarios

Based on these insights, here’s how the stock could play out in three different scenarios:

Base Case (Most likely)

  • Summary: Azure continues strong, AI monetization grows gradually, margins hold
  • Fair Value: $412
  • Probability: 50%

Bull Case

  • Summary: Copilot adoption surges, AI margins expand, regulation minimal
  • Valuation: $476
  • Probability: 30%

Bear Case

  • Summary: AI monetization lags, CapEx overwhelms margins, P/E compresses
  • Valuation: $336
  • Probability: 20%

Weighted Average Estimate

(412 × 0.5) + (476 × 0.3) + (336 × 0.2) = 206 + 142.8 + 67.2 = \textbf{$416/share}

Current Price: $435
Estimated Fair Value: $416
Implied Overvaluation: ~4.3%


Verdict

At $435, Microsoft stock appears slightly overvalued, with much of the AI success already priced in. That doesn’t mean it’s a sell—but it suggests a hold for long-term investors and a wait-for-a-better-entry for new buyers.

If you believe Copilot will be as transformative as Office or Azure, the bull case may still hold. But in the near term, upside looks limited unless Microsoft significantly accelerates AI monetization.

Final Call: Fair to mildly overvalued. Hold.


Call to Action

Want simple, no-fluff breakdowns like this delivered before the headlines hit?
Subscribe now at SWOTstock.com and get our next earnings deep dive straight to your inbox.


Disclaimer

This post is based solely on Microsoft’s official Q3 FY25 financial report and earnings call transcript. It does not constitute investment advice. Please conduct your own research or consult a financial advisor before making any investment decisions.


Leave a comment

Apple Q2 2025 Earnings: Strong Profits, Bigger Buybacks—But Is There Still Long-Term Upside?

Apple’s Q2 2025 earnings show record profits, a $100B buyback, and solid long-term fundamentals. See SWOT analysis, valuation scenarios, and what long-term investors need to know.

What Long-Term Investors Should Take From Apple’s Latest Earnings Report

If you’re building a long-term portfolio, Apple likely has a place in it. But with the stock near $183 and the company posting record earnings in Q2 2025, the question becomes: is Apple still a smart hold—or has most of the upside already been priced in?

Let’s break it down clearly and factually using Apple’s own numbers from its earnings report and investor call.


Consistency You Can Count On: Apple’s Q2 2025 in Context

Apple reported $95.4 billion in revenue, a 5% increase year-over-year, and delivered an EPS of $1.65, up 8%—the highest ever for a March quarter. The company also continued returning capital to shareholders at scale: $29 billion was distributed this quarter through buybacks and dividends.

For long-term holders, this quarter shows why Apple remains one of the most reliable compounders in the market:

  • Services revenue hit a new record at $26.6B, growing 12% YoY.
  • Mac and iPad sales both grew, reversing previous softness.
  • iPhone revenue held steady, up 2%, despite global macro pressures.
  • A new $100 billion buyback program was authorized, further enhancing shareholder value.

These are not flashy numbers—they’re the kind of consistent results that build wealth over time.


Long-Term Growth in Action: What the Last 5 Years Say

Apple’s steady growth is no accident. EPS has grown from $3.28 in FY2020 to an expected $6.40 in FY2025, nearly doubling in five years—despite global challenges.

Free cash flow has remained consistently above $90 billion annually, allowing for uninterrupted buybacks and dividend growth. This consistency is why Apple continues to anchor many long-term portfolios.

Line chart of Apple EPS and free cash flow from fiscal year 2020 to projected 2025, showing consistent financial growth

Key Metrics That Matter

MetricQ2 2025 ResultYoY Change
Revenue$95.4B+5%
EPS$1.65+8%
Free Cash Flow$24BSteady
Services Revenue$26.6B+12%
iPhone Revenue$46.8B+2%
Dividend$0.26/share+4%
Buyback Authorization$100BNew
Line chart showing Apple’s quarterly revenue and net income from Q2 2024 to Q2 2025, highlighting growth trends and profitability patterns

What Could Move the Stock: SWOT Breakdown

Understanding the strengths and risks from Apple’s own disclosures can help investors evaluate where the stock might go from here.

Strengths – Durable Growth and Massive Capital Returns

Apple is a cash machine. Record EPS, strong services performance, and a $100B buyback point to continued shareholder value creation.

Stock Price Impact Estimate: +$10 to +$18

  • Recurring high-margin revenue from services
  • Growing installed base across all regions
  • Buyback program supports share price

Weaknesses – Margin Pressure and Regional Slowdowns

Gross margins dipped this quarter, and revenue in China declined slightly. Wearables also underperformed against last year’s strong launch cycle.

Stock Price Impact Estimate: –$5 to –$10

  • FX and input cost headwinds
  • Gross margin contraction (down 340 bps)
  • Regional weakness in China and wearables

Opportunities – AI, Global Scale, and Supply Chain Shift

Apple Intelligence and Siri upgrades may drive the next hardware upgrade cycle. At the same time, Apple is shifting production for U.S. sales to India and Vietnam to reduce risk.

Stock Price Impact Estimate: +$6 to +12

  • Growth in international services markets
  • Supply chain resilience reduces geopolitical risk
  • New AI features deepen ecosystem loyalty

Threats – Tariffs and Legal Scrutiny

Apple faces $900M in tariff costs in the next quarter and is still navigating legal risks around its App Store practices.

Stock Price Impact Estimate: –$7 to –$15

  • Near-term margin hit from trade policy
  • Long-term impact from regulatory rulings
  • FX volatility in key markets

SWOT Summary

CategoryKey DriversEst. Stock Impact
StrengthsRecord EPS, services growth, $100B buyback+10 to +18
WeaknessesGross margin pressure, China softness–5 to –10
OpportunitiesAI integration, global services, supply chain shift+6 to +12
ThreatsTariffs, legal pressure, FX risks–7 to –15
Apple Q2 2025 SWOT analysis chart showing estimated stock price impact ranges for strengths, weaknesses, opportunities, and threats from -20 to 20 dollars

Valuation Scenarios: What’s the Long-Term Fair Value?

Apple’s fundamentals suggest a forward EPS of $6.40. Using long-term average P/E multiples, here are three valuation outcomes:

ScenarioEPSP/ETarget PriceProbability
Bull6.7531.3$21130%
Base6.4030.0$19250%
Bear6.1026.5$16220%

Weighted Fair Value: ~$191.7/share

Bar chart showing Apple Q2 2025 stock valuation scenarios for bull, base, and bear cases with estimated prices of 211, 192, and 162 dollars

At the current price of ~$183, Apple appears slightly undervalued, with 4–5% upside in the base case. For long-term investors, this aligns with steady, risk-adjusted growth—not hype-driven returns.


Should You Wait for a Better Entry?

At around $183, Apple trades near its weighted fair value of ~$191.7. That suggests limited short-term upside, but not overvaluation.

If you’re building a position or adding, a price closer to $175 may offer a more attractive risk-reward ratio, based on:

  • Base case fair value estimate of $192
  • Recent support levels and volatility range
  • Tariff risks temporarily weighing on sentiment

This doesn’t mean you need to wait—but it provides a disciplined approach if you’re cost-sensitive.


Final Take: Still a Core Holding for Long-Term Portfolios

Apple remains a model of long-term stability. It won’t double overnight, but it doesn’t need to. With strong cash flow, deep ecosystem loyalty, and AI expansion ahead, it’s a smart hold or buy-on-dips candidate for any long-term portfolio.


Want More No-Nonsense Stock Breakdowns?

We focus on what matters: financial results, strategy, and stock implications—without spin.
Subscribe to SWOTstock for clean, clear earnings analysis. Or follow us on Instagram @SWOTstock for mobile-friendly snapshots and updates.


Disclaimer

This blog is based solely on Apple’s official Q2 2025 financial report and earnings call. It is not investment advice. Always evaluate your own risk before investing.


Leave a comment