TL;DR Summary
Q3 2025 made something clear: the Magnificent Seven are no longer marching in lockstep. Nvidia (NVDA), Microsoft (MSFT), Amazon (AMZN), and Alphabet (GOOGL) showed measurable AI-driven financial strength. Meta (META) is monetizing AI well but digesting historic capex. Apple (APPL) and Tesla (TSLA) remain multi-year AI stories whose near-term financials still lag the narrative.
Our updated SWOTstock fair-value comparisons (using closing stock prices on November 21, 2025) reveal a more nuanced picture: several names are fairly priced, a few slightly stretched, one deeply undervalued, and one dramatically overvalued. Meanwhile, Berkshire’s investment stance, SoftBank’s AI pivot, macro caution from economists and bank CEOs, and rising enterprise AI adoption form a textured backdrop that will shape the group’s trajectory into 2026.
1. The Quarter in Context — Where AI’s Reality Meets AI’s Price Tag
This was the quarter where AI’s financial reality finally met its hype cycle.
Across the seven companies, management teams spoke openly about:
- surging AI workload demand
- GPU shortages and data center bottlenecks
- rising inference and training costs
- early but measurable AI monetization
- intensifying competitive pressure
- execution challenges ahead
AI is no longer a lab experiment.
It is simultaneously a revenue driver, a cost burden, a competitive moat, and a valuation amplifier.
But the timing of when AI adds profit is becoming the central question — and the Magnificent Seven are no longer aligned on that timeline.
2. Nvidia — Still the Center of Gravity for AI Compute
Nvidia’s quarter didn’t need theatrics. The numbers spoke loudly. Demand for Blackwell continues to exceed supply, sovereign AI projects are scaling faster than expected, and enterprise inference clusters are expanding in both size and diversity. Jensen Huang reiterated that this is a “multi-year infrastructure transition,” and nothing in the quarter challenged that view.
Our recent SWOTstock analysis underscored how Nvidia’s moat now stretches well beyond GPUs: networking, CUDA, software stacks, developer ecosystems, and cloud partnerships. The company’s weakness — potential hyperscaler capex moderation — feels like a 2027–2028 conversation, not a 2025 risk. Meanwhile, its opportunities in inference and industrial automation continue to widen.
Valuation & Investor Risk
Fair value: $345
Current price: $178.88
Valuation: –48% below fair value
Nvidia remains the single most undervalued name in the group based on fundamentals. Market fears around slowing AI capex have pushed the stock far below intrinsic value — creating a rare long-term dislocation.
3. Microsoft — Where Enterprise AI Becomes a System, Not a Feature
Microsoft’s call revealed something deeper about the enterprise AI transition. Satya Nadella noted customers are “prioritizing AI workloads at every layer,” and Azure’s 29% surge offered the proof. AI pull-through is now visible across Office, GitHub, Windows, and security — a dynamic we highlighted in our SWOTstock Q1 FY2026 review.
This strength comes with meaningful trade-offs. GPU procurement, energy usage, and rapid data center expansion continue to pressure gross margins, and management acknowledged that AI demand is running faster than their infrastructure rollout. Microsoft’s opportunity lies in scaling Copilot monetization; threats center on hyperscaler rivalry and the growth of open-source alternatives.
Valuation & Investor Risk (Updated)
Fair value: $453
Current price: $472.12
Valuation: +4% above fair value
Microsoft is priced just slightly above intrinsic value — a reasonable premium for a company executing at its scale. Investors are assuming disciplined execution, not perfection.
4. Amazon — AWS Finds Its Second Wind
AWS had entered Q3 with momentum, and delivered on it convincingly. Andy Jassy highlighted that AI is driving “new workloads and returning workloads,” and customer adoption of Bedrock and Amazon’s custom silicon stack is rising. Our SWOTstock Q3 2025 review anticipated this inflection point: AWS’s reacceleration is real.
Amazon’s ecosystem remains its moat — retail, logistics, ads, and cloud feed one another. Still, thin margins in retail remain the company’s Achilles’ heel. AI-enabled silicon (Trainium, Inferentia) represents a long-term opportunity, while hyperscaler competition remains the biggest external threat.
Valuation & Investor Risk (Updated)
Fair value: $216
Current price: $220.69
Valuation: +2% above fair value
Amazon trades essentially at fair value. This neutral positioning reflects balanced expectations — investors aren’t paying for perfection, but they do expect AWS to continue its AI-driven reacceleration.
5. Alphabet — A $100B Quarter That Still Looks Reasonably Priced
Alphabet’s first-ever $100B quarter was impressive, but the more meaningful story lay in the AI-driven improvements across Search, YouTube, and Cloud. Sundar Pichai emphasized “multi-product lift from Gemini,” pointing directly to how AI is improving user satisfaction, ad performance, and enterprise value.
In our SWOTstock analysis of Alphabet’s Q3 2025 results, we emphasized how broad its AI leverage is: Search, ads, Cloud, productivity tools, hardware, models — everything points in the same direction. Weaknesses remain in regulatory pressure and hardware performance, but Alphabet’s AI improvements are showing up in real numbers, not just narratives.
Valuation & Investor Risk
Fair value: $284
Current price: $299.65
Valuation: +5.5% above fair value
Alphabet has now moved slightly above intrinsic value, reflecting growing recognition of its AI execution — but still far from being priced aggressively.
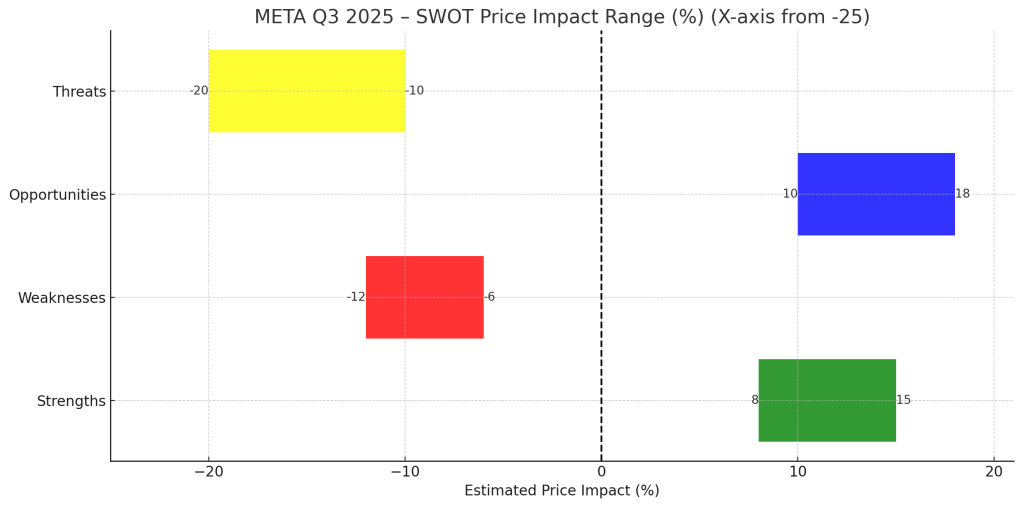
6. Meta — Strong AI Monetization Meets a Wall of Capex
Meta’s quarter shows what happens when AI drives real engagement and advertiser ROI. Zuckerberg noted that AI recommendations continue lifting time spent, and advertisers are seeing better-than-expected performance — a trend we highlighted in our Meta SWOTstock analysis.
But Meta is also facing its heaviest infrastructure cycle ever: training clusters, inference scaling, and model development are consuming enormous amounts of capex. This creates a tension between short-term margin pressure and long-term AI-driven platform value.
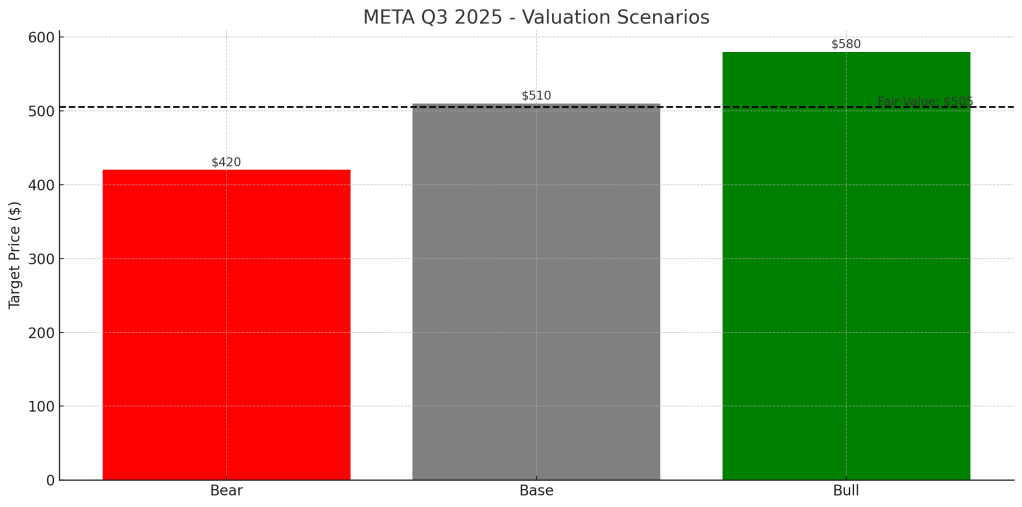
Valuation & Investor Risk (Updated)
Fair value: $505
Current price: $596.75
Valuation: +18% above fair value
Meta now trades at a moderate premium, with investors clearly betting on future efficiency gains and new revenue models from AI-driven business messaging and agents.
7. Apple — AI as a Slow-Burn Catalyst, Not a Quarterly Driver
Apple’s quarter reinforced that AI is a multi-year catalyst rather than a quarterly earnings driver. Tim Cook highlighted strong early reception to Apple Intelligence, noting that AI will “create new possibilities across the entire ecosystem.” Our SWOTstock Q4 2025 review observed the same: Apple’s AI strategy is deliberate, tied tightly to user experience and ecosystem retention.
Apple’s strength remains its brand, user base, and rising services ARPU. Weakness lies in its later AI ramp compared to peers. The opportunity is the upcoming AI-driven upgrade supercycle; threats revolve around regulation and Android competitors accelerating AI features.
Valuation & Investor Risk (Updated)
Fair value: $272.5
Current price: $271.49
Valuation: –0.4% below fair value
Apple trades almost exactly at intrinsic value — a balanced setup where execution on AI integration will determine whether upside emerges.
8. Tesla — AI Optionality vs. Automotive Reality
Tesla remains caught between future-facing autonomy ambitions and current automotive pressures. Elon Musk reiterated confidence in FSD v14 and the long-awaited robotaxi chapter. But margins remained under pressure from price cuts, competition, and rising battery input costs — themes we explored in depth in our Tesla SWOTstock piece.
Tesla’s strengths include brand power, manufacturing scale, and its energy business. Weaknesses lie in margin deterioration. Opportunities center on autonomy and energy storage. Threats include rapidly intensifying global EV competition.
Valuation & Investor Risk (Updated)
Fair value: $227
Current price: $391.09
Valuation: +72% above fair value
Tesla is the clear valuation outlier — the only name trading at a bubble-like premium relative to intrinsic value. The stock’s trajectory depends almost entirely on autonomy becoming financially meaningful.
9. Valuation Summary
Valuation Map

Valuation Summary Table

AI Pressure vs. AI Payoff Matrix

10. Reality Check — Conviction, Rotation, Warnings, and the Quiet Rise of Real AI Productivity
Earnings tell one story.
But the tone of the AI cycle is increasingly being shaped by forces outside quarterly numbers — long-term capital, global macro sentiment, and the slow but steady adoption of AI inside traditional enterprises.
This quarter, those external signals became impossible to ignore.
Berkshire’s Move: A Value Investor Quietly Endorses AI’s Durability
When Berkshire Hathaway quietly revealed its Alphabet position — a point we explored deeply in our SWOTstock editorial — it wasn’t just another 13F footnote. It was the clearest sign yet that AI is beginning to pass Buffett’s durability test. Berkshire typically avoids fast-moving tech cycles; they don’t buy “stories,” they buy “cash flows.”
And yet here they were buying Alphabet, precisely at the moment when:
- AI-enhanced Search signal quality is strengthening
- YouTube engagement is rising through better recommendations
- Google Cloud is finally approaching structural profitability
It said something the market had refused to acknowledge:
Alphabet’s AI future isn’t hype — it’s already showing up in the economics.
SoftBank’s Rotation: Not an Exit, a Migration Up the Value Chain
SoftBank selling Nvidia was initially interpreted as a warning shot. But the fuller story revealed something very different — and very classic SoftBank. As we’ve written before, Masayoshi Son has a long history of chasing platform transitions early (ARM, Alibaba, high-scale telecom).
Selling Nvidia → buying OpenAI wasn’t a retreat.
It was a move up the AI stack — from hardware to intelligence layers.
This matters because it signals where some of the most risk-embracing capital believes the next wave of value will be captured:
not only “running AI,” but shaping AI behavior, reasoning, and agents.
SoftBank’s move didn’t contradict Nvidia’s story — it simply pointed to the next stage of the AI economy.
Economists & Bank CEOs: AI’s Promise Is Enormous — but the Timing Isn’t Linear
If Berkshire and SoftBank brought conviction, the macro community supplied caution.
But the caution wasn’t about AI itself — it was about the cycle.
Economists across major institutions noted that the current investment boom has early signs of a classic capex surge, where spending outpaces revenue for several years before productivity kicks in. Goldman Sachs described this moment as “the early phase of historical capex bubbles,” not to dismiss AI, but to contextualize how revolutions usually unfold: slow payoff, fast investment.
Bank executives echoed this sequencing.
Jamie Dimon put it bluntly during an investor Q&A:
“We spend about $2 billion a year on AI and still only break even. The big returns will come — but they won’t come evenly.”
This wasn’t skepticism — it was realism.
AI is transformative, but transformations take time to compound into margins.
And investors sometimes forget: even real revolutions have uneven financial arcs.
Enterprise AI Adoption: Quiet, Steady, and Finally Real
Lost in the noise of stock moves and capex fights is the most encouraging trend of all — AI is finally making people faster at their jobs.
Not in abstract anecdotes, but in measurable ways.
BNY Mellon, for example, didn’t just “deploy AI.” They put AI in the hands of their workforce.
Sixty percent of employees onboarded to their internal AI platform.
More remarkably, over 5,000 employees built their own AI agents.
This is what real AI transformation looks like — not pilots, not press releases, but cultural adoption.
Large insurers and banks reported early wins too:
10–15 percentage-point improvements in efficiency ratios from AI-assisted workflows.
These aren’t moonshot projects; they’re operational fixes that matter in the P&L.
It’s quiet because enterprises move slowly.
It’s real because it’s happening anyway.
And it’s meaningful because productivity is the only sustainable foundation of long-term valuation.
Together, these signals reveal a more grounded truth about AI in late 2025:
AI isn’t a mania.
AI isn’t a guarantee.
AI is becoming work — real work — inside real companies.
And that’s where the long-term winners will come from.
11. What to Watch Next
Nvidia: Does hyperscaler capex actually slow?
Microsoft: Does Copilot revenue ramp fast enough to justify valuation?
Amazon: Can AWS sustain AI-driven reacceleration?
Alphabet: Do Search and YouTube continue to show AI signal gains?
Meta: Do margins hold against historic capex?
Apple: Does AI spark a true upgrade supercycle?
Tesla: Does FSD v14 meaningfully lift subscription revenue?
Conclusion — The 2026 Setup: Opportunity Meets Pressure
The Magnificent Seven are no longer a single trade.
Some are earning AI returns today.
Some are still building toward them.
Some are priced as if the future has already arrived.
AI is real.
Its productivity gains are real.
But expectations are rising faster than financial results, and valuations are where that tension becomes visible.
2026 will be the year the market distinguishes between:
- AI built into the P&L
- AI built into the narrative
- AI built into the stock price
And for growth investors, that clarity could create the most important opportunities — and risks — since the beginning of the AI supercycle.