
TL;DR
Microsoft’s (MSFT:NASDAQ) latest quarter strengthens its growth story. Azure is expanding rapidly, enterprise cloud revenue continues to rise, and Microsoft is finding more ways to charge for AI through subscriptions and consumption.
The harder question is how much cash this growth will ultimately deliver to shareholders. Infrastructure spending is absorbing a greater share of operating cash, while future capacity commitments extend well beyond the current year.
For growth investors, Microsoft remains a compelling business with substantial opportunities. At our dated closing-price benchmark of $521.91, however, our probability-weighted fair value of approximately $542 offers only a 3.6% margin of safety.
Quarter Recap
Microsoft reported fiscal first-quarter revenue of $92.28 billion, up 19%, for the period ended September 30, 2026. Operating income increased 21% to $45.92 billion.
GAAP diluted earnings per share rose 32% to $4.92. Adjusted EPS, excluding the effects of OpenAI investments, increased 18% to $4.89. The distinction matters: OpenAI investment effects benefited this quarter’s reported earnings while reducing the prior-year comparison.
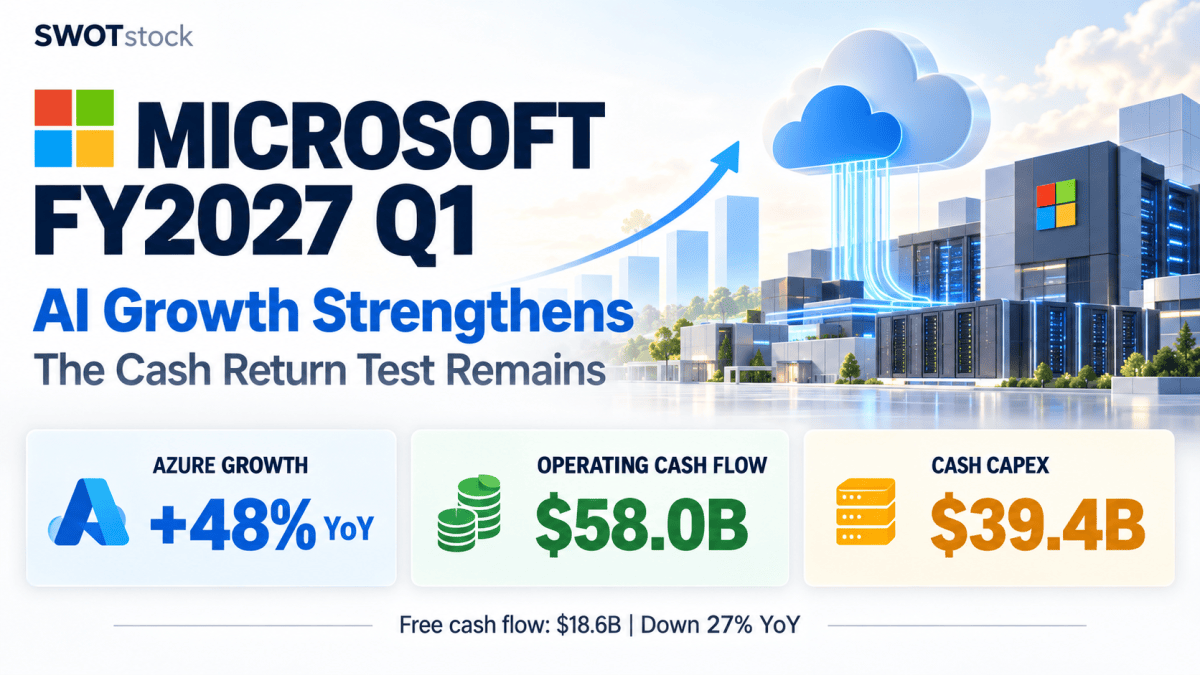
Cash generation and reinvestment moved at different speeds. Operating cash flow reached $58.0 billion, compared with $45.06 billion a year earlier. Cash additions to property and equipment increased to $39.37 billion from $19.39 billion. Calculated free cash flow consequently declined approximately 27%, to $18.63 billion.
The business is generating more operating cash, but retaining less after capital expenditure.
Key Highlights
Microsoft Cloud revenue reached $63.9 billion, up 30%. Azure growth accelerated to 48%, from 42% in the preceding quarter. Cloud gross margin was 66%, versus 68% a year earlier.
Enterprise software also continued expanding. Microsoft 365 commercial cloud revenue grew 17%, while commercial seats increased 5%. Commercial remaining performance obligations reached $677 billion, substantially above the prior year but slightly below the preceding quarter. These contracted future revenues are not equivalent to cash already collected.
Management reported more than 75% sequential growth in Copilot customers actively consuming usage-based credits. It did not disclose an updated total Copilot paid-seat count. Adoption evidence is encouraging, but does not establish standalone profitability.
Management also attributed some capital expenditure timing to delayed third-party capacity. It expects spending above $50 billion next quarter and acceleration in fiscal H2. This suggests that a lower spending figure in one quarter should not automatically be interpreted as a lasting reduction in investment requirements.
SWOT Analysis
Microsoft’s principal advantage is its ability to connect infrastructure, development tools, enterprise applications and distribution. Its principal challenge is converting that reach into attractive returns after the cost of supplying AI.
The price-impact ranges below are conditional sensitivities, not forecasts. They combine hypothetical changes in sustainable earnings and the valuation multiple. The assumptions are ours, the factors overlap, and the ranges must not be added together.
Strengths
Azure’s demand conversion: estimated impact +5% to +10%.
Rapid revenue growth gives Microsoft an opportunity to spread infrastructure and development costs across a larger business. If demand conversion raises sustainable EPS by 5–10%, with the earnings multiple unchanged, the corresponding valuation sensitivity is approximately +5–10%.
Enterprise distribution and broader customer spending: estimated impact +3% to +9%.
Existing customer relationships can support additional spending on security, AI and development services. Higher revenue per customer could improve earnings durability. Our range assumes sustainable EPS improves 3–6%, accompanied by a 0–3% increase in the valuation multiple.
Weaknesses
Weaker cash conversion after investment: estimated impact −5% to −12%.
Heavy capital requirements reduce the cash available for distributions and other investment choices. If this persists, investors may assign less value to each dollar of accounting earnings. Our sensitivity holds EPS constant and applies a 5–12% reduction in the earnings multiple.
Slower seat expansion and pressure on cloud margins: estimated impact −3% to −9%.
Microsoft increasingly needs consumption, premium products and revenue per customer to sustain growth. If these contributions fall short, earnings could disappoint. Our range combines a 3–6% sustainable EPS shortfall with a 0–3% reduction in the multiple.
Opportunities
Consumption-based agents: estimated impact +5% to +16%.
Successful agents could expand customer spending beyond conventional software subscriptions. The opportunity depends on repeat usage and demonstrable economic value. Our range assumes a 5–10% improvement in sustainable EPS and a 0–5% valuation premium.
Greater productivity from installed infrastructure: estimated impact +4% to +11%.
More workloads served by existing assets would improve the relationship between revenue and invested capital. Our sensitivity assumes sustainable EPS improves 4–8%, with a 0–3% increase in the multiple. This opportunity overlaps with Azure growth and should not be counted separately in an aggregate forecast.
Threats
Capacity commitments ahead of profitable demand: estimated impact −13% to −19%.
If utilization or pricing weakens after capacity is committed, infrastructure costs would be supported by less revenue than anticipated. Our range combines an 8–12% EPS shortfall with a 5–8% multiple contraction.
Competition reducing Microsoft’s share of AI value: estimated impact −8% to −16%.
Lower-cost models and competing agents could increase AI activity while limiting what Microsoft can charge. The outcome depends on whether cost improvements keep pace with pricing pressure. Our sensitivity combines a 5–10% EPS shortfall with a 3–7% reduction in the multiple.
Valuation Scenarios
We value Microsoft using estimated FY2027 adjusted earnings and forward P/E multiples. Adjusted earnings exclude OpenAI investment effects but retain operating costs and stock-based compensation.
These are estimates of fair value today using forward earnings, rather than June 2027 price targets. Revenue, margins, multiples and probabilities are independent assumptions.
Bear Case: Approximately $404
The bear case assumes continued cloud expansion alongside weaker pricing, capacity timing problems and pressure on profitability.
We estimate revenue of $380 billion, an adjusted net margin of 36%, and 7.45 billion diluted shares. That produces adjusted EPS of approximately $18.36.
Applying a 22× multiple gives a value of approximately $404, or 23% downside from $521.91. We assign this scenario a 25% probability.
Base Case: Approximately $552
The base case assumes Azure and Microsoft 365 sustain growth, while efficiency improvements partly offset depreciation and the changing revenue mix.
Revenue of $395 billion, an adjusted net margin of 38.5%, and 7.44 billion diluted shares produce adjusted EPS of approximately $20.44.
At 27× earnings, estimated value is approximately $552, or 6% upside. We assign this scenario a 55% probability.
This valuation already gives Microsoft substantial credit for durable growth and eventual improvement in cash conversion.
Bull Case: Approximately $685
The bull case assumes exceptional Azure momentum, materially greater agent consumption and improving infrastructure economics.
Revenue of $410 billion, an adjusted net margin of 40%, and 7.42 billion diluted shares produce adjusted EPS of approximately $22.10.
Applying a 31× multiple gives approximately $685, or 31% upside. We assign this scenario a 20% probability.
Both earnings delivery and a premium multiple are necessary for this outcome.
Probability-Weighted Fair Value
Weighting the unrounded scenarios produces approximately $541.57, rounded to $542 per share.
Against $521.91, that represents approximately 4% upside and a 3.6% margin of safety, calculated as the discount to estimated fair value.
The result is sensitive to the earnings multiple. Holding base-case EPS constant, 24× earnings produces approximately $491, while 30× produces $613. Our central estimate should therefore be treated as a judgment within a wide range.
Verdict
Microsoft’s growth thesis is stronger after this quarter. The company is demonstrating that enterprise cloud and AI demand can generate substantial revenue.
The return on the expanding capital base remains less firmly established. Microsoft’s filing reports approximately $71 billion of finance lease liabilities and $364.6 billion of additional leases that had not commenced. The latter extend across future commencement dates and lease terms, with some subject to contractual conditions. They nevertheless represent commitments that matter to future flexibility.
For a Type 1 growth investor, Microsoft merits continued attention. Business execution risk appears moderate, while valuation and capital-intensity risk remain meaningful.
At our $521.91 benchmark, the estimated cushion is narrow. A 15% margin of safety against our weighted value would correspond to approximately $460; a 20% margin would correspond to approximately $433. These are conditional valuation references, not predictions.
The next evidence to watch is whether cash generation begins to catch up with the infrastructure commitment.
What Are You Watching?
Which will matter more for Microsoft’s long-term returns: broader adoption of paid agents, higher utilization of infrastructure, or improved economics per workload?
Disclaimer
This article is for educational and informational purposes and is not personalized investment advice. Forecasts, scenario probabilities and valuation multiples reflect independent judgment and may be wrong. The price benchmark is Microsoft’s October 30, 2026 closing price of $521.91.

