
TL;DR Summary
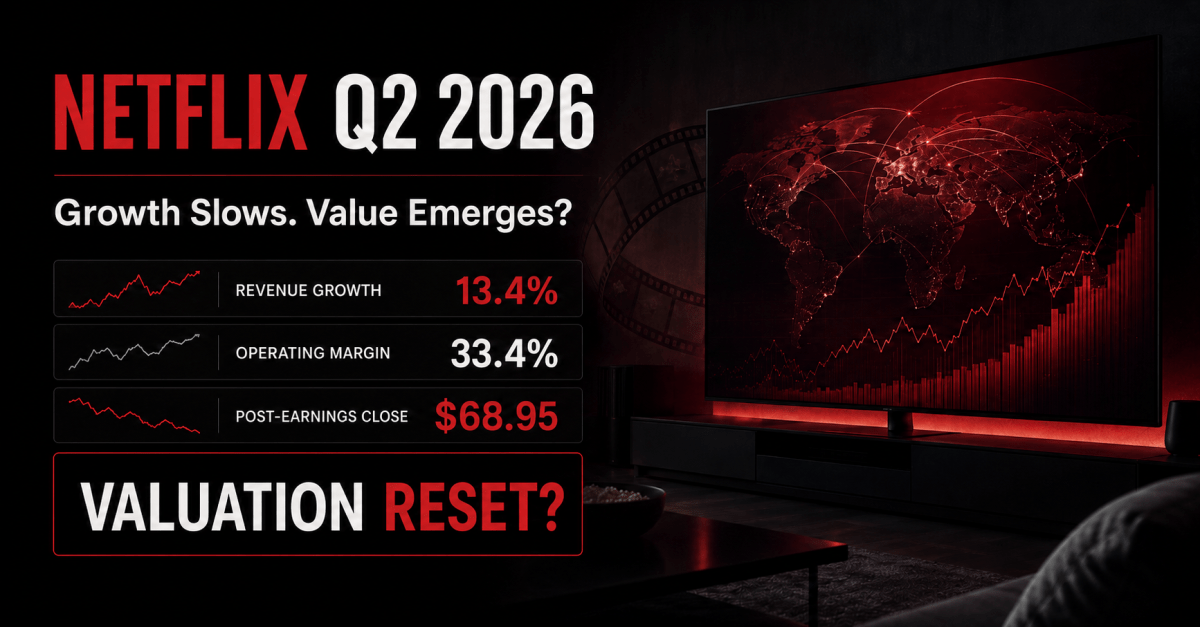
Netflix delivered another profitable quarter, but the results did not provide the acceleration needed to support its pre-earnings valuation. Q2 revenue increased 13.4% to $12.56 billion, operating income reached $4.19 billion and the operating margin came in at 33.4%.
The concern lies in the direction of growth. Revenue growth slowed from 16.2% in Q1 to 13.4% in Q2, while Netflix forecasts another decline to 11.7% in Q3. Management also maintained rather than raised the midpoint of its full-year revenue outlook.
Netflix shares closed at $68.95 on July 17, down 7.26% in the first full session after earnings. The decline appears to be a valuation reset rather than evidence of a sudden deterioration in the business.
Based on Netflix’s official financial guidance and a probability-weighted free-cash-flow valuation:
- Bear value: $51
- Base value: $77
- Bull value: $102
- Probability-weighted fair value: $74
Netflix is modestly undervalued at $68.95, but the discount is not large enough to provide a substantial margin of safety.
Quarter Recap
Netflix reported Q2 2026 revenue of $12.56 billion, up 13.4% year over year and broadly in line with its internal forecast. Revenue grew by double digits across all four geographic regions, supported by membership growth, pricing and increased advertising revenue.
Operating income increased 11.1% to $4.19 billion, while diluted EPS rose from $0.72 to $0.80. The operating margin declined from 34.1% to 33.4%, although it exceeded Netflix’s own 32.6% forecast.
Management attributed the margin outperformance mainly to expense timing. That distinction matters because costs shifting between quarters do not necessarily increase Netflix’s long-term earnings power.
Free cash flow declined from $2.27 billion to $1.53 billion, partly because of higher cash-tax payments associated with the Warner Bros. termination fee. Netflix nevertheless maintained its full-year free-cash-flow forecast of approximately $12.5 billion.
For the full year, Netflix narrowed its revenue outlook from $50.7–$51.7 billion to $51.0–$51.4 billion. The midpoint remained unchanged at $51.2 billion. The company also maintained its 31.5% operating-margin target and approximately $3 billion advertising-revenue forecast.
The shares initially fell almost 12% after the report but recovered to close at $68.95, down 7.26%. The recovery suggests that some investors regarded the initial reaction as excessive, but the closing decline still represents a meaningful reduction in Netflix’s valuation premium.
Key Highlights
Netflix remains a highly profitable and cash-generative entertainment platform. However, the quarter also exposed the gap between a strong business and the level of growth required to support a premium valuation.
- Revenue reached $12.56 billion, increasing 13.4% year over year.
- Operating income increased 11.1% to $4.19 billion.
- Operating margin was 33.4%, compared with 34.1% a year earlier and Netflix’s 32.6% forecast.
- Diluted EPS increased 11.1% to $0.80.
- Free cash flow declined approximately 33% to $1.53 billion, but the full-year $12.5 billion forecast remained unchanged.
- All geographic regions delivered double-digit reported growth. UCAN grew 10%, EMEA 14%, LATAM 21% and APAC 16%.
- First-half viewing hours increased 2% to more than 97 billion hours.
- Advertising revenue remains on track to reach approximately $3 billion, roughly double the previous year.
- Netflix used generative-AI workflows in approximately 300 titles, primarily in post-production.
- Cloud-game monthly active players increased elevenfold since October 2025, although gaming remains small relative to Netflix’s overall business.
- Netflix repurchased $4.7 billion of shares, its largest quarterly repurchase to date.
- Q3 revenue growth is forecast at 11.7%, continuing the deceleration from Q1 and Q2.
SWOT Analysis
Netflix’s Q2 results show a company with considerable scale, profitability and monetization power. Its central challenge is whether advertising, pricing and new entertainment formats can offset slowing subscription growth without weakening engagement or requiring disproportionate content spending.
The price-impact ranges below are estimated sensitivities relative to the $68.95 post-earnings closing price. They overlap and should not be added together.
Strengths
- Healthy double-digit revenue growth: estimated impact +5% to +10%. Netflix increased Q2 revenue by 13.4% and expects 13%–14% growth for the full year. Maintaining that growth rate at Netflix’s scale demonstrates the durability of the platform.
- High profitability: estimated impact +6% to +12%. The Q2 operating margin reached 33.4%, while the full-year target remains 31.5%. Management’s outlook implies more than 20% operating-income growth in 2026.
- Demonstrated pricing power: estimated impact +4% to +9%. Netflix said recent price increases performed consistently with previous increases and its expectations. Management continues to report healthy acquisition and retention.
- Global distribution economics: estimated impact +5% to +10%. Netflix can distribute locally produced content across its global footprint. Non-English titles generated more than one-third of first-half viewing, improving the potential return on content investment.
- Strong cash generation: estimated impact +4% to +8%. Approximately $12.5 billion of expected 2026 free cash flow gives Netflix significant capacity to reinvest and repurchase shares.
- Share-count reduction: estimated impact +3% to +7%. Netflix repurchased $4.7 billion of shares during Q2, while its diluted share count declined approximately 2% year over year.
Weaknesses
- Revenue deceleration: estimated impact −8% to −15%. Reported growth has declined from 17.6% in Q4 2025 to 16.2% in Q1 2026 and 13.4% in Q2. Q3 guidance calls for 11.7%.
- Limited engagement growth: estimated impact −5% to −10%. First-half viewing hours increased only 2%, significantly below revenue growth. Pricing and monetization are currently contributing much more to growth than additional consumption.
- Reduced engagement transparency: estimated impact −3% to −8%. Netflix will publish its detailed What We Watched report annually rather than twice yearly beginning in 2027.
- Year-over-year margin contraction: estimated impact −2% to −5%. Q2 operating margin declined by 70 basis points because of higher first-half content amortization.
- Quarterly cash-flow volatility: estimated impact −3% to −6%. Q2 free cash flow declined approximately 33%, although Netflix maintained its full-year forecast.
Opportunities
- Advertising monetization: estimated impact +8% to +16%. Netflix expects approximately $3 billion of advertising revenue in 2026. Management said the monetization gap between the advertising plan and standard ad-free plan continues to narrow.
- Plan and pricing optimization: estimated impact +4% to +9%. Netflix is testing free trials, introductory pricing and upgrade offers to reach different customer segments without relying on a single global pricing approach.
- Live programming: estimated impact +4% to +10%. Live content is expected to represent slightly more than 5% of content spending but has generated six of Netflix’s ten largest new-member sign-up days over the last five years.
- AI-enhanced production and discovery: estimated impact +3% to +8%. AI could improve content recommendations, shorten production timelines and increase the quality achieved per dollar of content spending.
- Games, podcasts and creator programming: estimated impact +3% to +10%. These formats could increase daytime and mobile engagement, broadening Netflix beyond conventional television and film viewing.
- Broadcaster partnerships: estimated impact +2% to +7%. The TF1 integration in France provides a potentially capital-light way to add local, live and on-demand programming without acquiring an entire media company.
Threats
- Competition for attention: estimated impact −7% to −15%. Netflix competes with streaming platforms, social video, creators, gaming, sports and traditional television.
- Content-return risk: estimated impact −6% to −13%. Netflix had $25.1 billion of streaming content obligations at quarter-end. Content outcomes are unpredictable, while much of the spending is committed before audience demand is known.
- Pricing elasticity: estimated impact −5% to −12%. Continued pricing power requires Netflix to keep increasing perceived value. Future increases could produce higher churn if engagement or content quality weakens.
- Advertising execution: estimated impact −4% to −10%. Netflix must improve fill rates, measurement, advertiser access and campaign performance to realize the full value of its advertising inventory.
- New-business dilution: estimated impact −3% to −8%. Games, live events and podcasts could consume capital without generating adequate returns if early engagement signals do not translate into acquisition or retention.
- Capital-allocation risk: estimated impact −4% to −10%. Management says Netflix is primarily a builder rather than a buyer, but selective acquisitions still create the possibility of overpaying for content or strategic assets.
Valuation Scenarios
The valuation uses free cash flow because Netflix’s 2026 reported net income includes the Warner Bros. termination fee, making unadjusted EPS a less reliable measure of recurring earnings power.
Netflix forecasts approximately $12.5 billion of 2026 free cash flow. Divided by the Q2 diluted share count of 4.261 billion, that equals approximately $2.93 per share.
At the $68.95 post-earnings close, Netflix trades at approximately 23.5 times guided 2026 free cash flow per share.
The following 2027 projections and valuation multiples are independent SWOTstock assumptions, not management guidance or analyst consensus.
Bear Scenario — $51
- Probability: 30%.
- Revenue growth falls into the high single digits as engagement remains modest and pricing becomes more difficult.
- Advertising continues growing but remains too small to prevent overall deceleration.
- Free cash flow declines approximately 5% to $11.9 billion.
- Diluted shares decline modestly to approximately 4.22 billion.
- Free cash flow per share equals approximately $2.82.
- Applying an 18-times multiple produces a fair value of approximately $51.
- This represents approximately 26% downside from $68.95.
Base Scenario — $77
- Probability: 50%.
- Netflix delivers its 2026 guidance and sustains low-double-digit revenue growth into 2027.
- Advertising expands, pricing remains effective and content spending grows more slowly than revenue.
- Free cash flow increases approximately 12% to $14.0 billion.
- Repurchases reduce diluted shares to approximately 4.18 billion.
- Free cash flow per share reaches approximately $3.35.
- Applying a 23-times multiple produces a fair value of approximately $77.
- This represents approximately 12% upside from $68.95.
Bull Scenario — $102
- Probability: 20%.
- Revenue growth stabilizes in the low-to-mid teens.
- Advertising materially improves monetization while live programming strengthens acquisition.
- AI improves content productivity, and games and creator programming add incremental engagement.
- Free cash flow increases approximately 20% to $15.0 billion.
- Repurchases reduce diluted shares to approximately 4.13 billion.
- Free cash flow per share reaches approximately $3.63.
- Applying a 28-times multiple produces a fair value of approximately $102.
- This represents approximately 48% upside from $68.95.
Probability-Weighted Fair Value
- Bear contribution: $51 × 30% = $15.30
- Base contribution: $77 × 50% = $38.50
- Bull contribution: $102 × 20% = $20.40
- Probability-weighted fair value: approximately $74 per share.
A reasonable central fair-value range is approximately $70–$78.
Verdict
Netflix remains one of the strongest global entertainment businesses. It has scale, pricing power, high margins, growing advertising revenue and substantial free cash flow. The Q2 report did not undermine those strengths.
However, a strong business is not automatically an attractive stock at every price. Revenue growth is decelerating, engagement growth remains modest and the company will provide detailed viewing data less frequently.
The decline to $68.95 improved the valuation, but the approximately 7% discount to the $74 probability-weighted fair value is not a wide margin of safety. The current price appears reasonable for a growth investor who believes Netflix can maintain low-double-digit growth, but it does not yet qualify as an obvious low-risk opportunity.
Netflix becomes more attractive in the low $60s, where the price would provide greater protection against further multiple compression. At $68.95, the stock is modestly undervalued but still dependent on successful execution.
Call to Action
Would you buy Netflix after its post-earnings decline, or does slowing revenue growth justify waiting for a larger margin of safety?
Follow SWOTstock for independent earnings analysis based on company financials and management commentary.
Official source: Netflix Q2 2026 shareholder letter and financial statements
Disclaimer
This article is for informational and educational purposes only and does not constitute financial advice, investment advice or a recommendation to buy or sell any security.
The valuation scenarios are based on assumptions derived from Netflix’s official financial results and management guidance. Actual results may differ materially because of changes in competition, content performance, consumer behavior, foreign-exchange rates, advertising demand, pricing, regulation and broader economic conditions.
Investors should conduct their own research and consider their financial circumstances, objectives and risk tolerance before making investment decisions.

