
TL;DR
Alphabet (GOOGL:NASDAQ) delivered another powerful operating quarter. Revenue increased 25%, operating income rose 30%, Google Search grew 12%, and Google Cloud revenue more than doubled while its operating margin reached approximately 36%.
The results provide substantial evidence that Alphabet is succeeding in AI. The Gemini app reached one billion users, demand for enterprise AI remained strong, and TPU-system sales became a meaningful contributor to Cloud revenue.
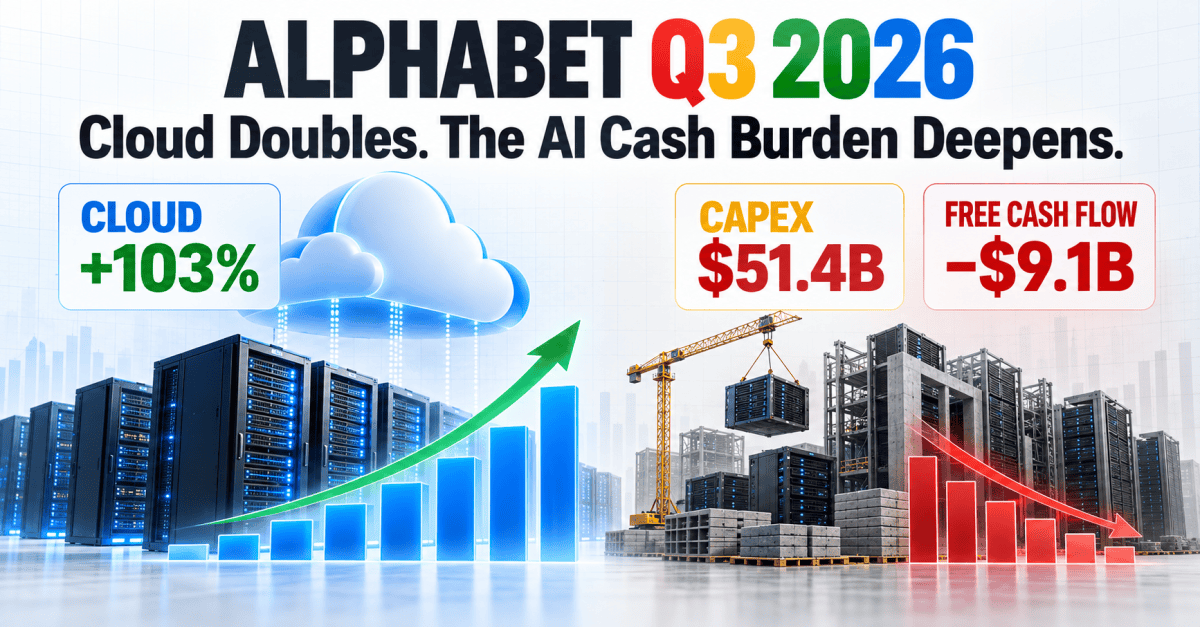
But the financial burden also increased. Capital expenditure reached $51.4 billion, exceeded operating cash flow and pushed quarterly free cash flow to negative $9.1 billion. Alphabet continued issuing common shares and debt while repurchasing no stock.
The shares responded with an approximately 10% pre-market decline. After normalizing the exceptional gains and losses in Alphabet’s investment portfolio, we estimate trailing earnings power of approximately $10.95 per share.
Our updated probability-weighted fair value is approximately $304 per share, down from the previous $324 estimate. Against a pre-market price near $292, Alphabet appears modestly undervalued—but the estimated margin of safety is only about 4%.
Alphabet Q3 2026 Earnings Recap
Alphabet reported third-quarter revenue of $127.6 billion, an increase of 25% from the previous year.
Operating income increased 30% to $40.6 billion, while operating margin reached 31.8%.
The principal reported figures were:
- Revenue: $127.6 billion, up 25%
- Operating income: $40.6 billion, up 30%
- Operating margin: 31.8%
- Net income available to common shareholders: $26.2 billion
- Diluted EPS: $2.12
- Operating cash flow: $42.3 billion
- Capital expenditure: $51.4 billion
- Free cash flow: negative $9.1 billion
Reported EPS fell from $2.87 to $2.12, but this comparison requires context.
Alphabet recorded an $8.7 billion loss on equity securities. The company disclosed that this reduced net income by $6.7 billion and diluted EPS by $0.55.
Adding back that disclosed effect produces normalized quarterly EPS of approximately $2.67. This is an analytical adjustment rather than a company-reported non-GAAP measure.
Key Highlights
Google Cloud Has Become a Major Profit Engine
Google Cloud delivered the quarter’s strongest operating performance.
Cloud revenue increased 103% to $30.7 billion, compared with $15.2 billion one year earlier. Operating income rose from $3.6 billion to $11.1 billion.
Its implied operating margin expanded from approximately 23.7% to 36.2%.
More importantly, the incremental operating margin on Cloud’s additional year-over-year revenue was approximately 48%. This indicates that the business generated substantial operating leverage while more than doubling revenue.
Alphabet identified enterprise AI infrastructure, enterprise AI solutions, core GCP services and TPU-system sales as contributors to the growth.
This matters because Alphabet’s AI infrastructure is not supporting only experimental products. Cloud is already turning AI demand into substantial revenue and operating profit.
The unresolved issue is whether this segment-level profit can eventually exceed the enormous capital investment being made across Alphabet.
Search Remains Resilient
Google Search and other revenue increased 12% to $63.4 billion.
Management reported that Search’s year-over-year query-growth rate was the highest in five years. It also said AI was contributing to overall query growth, including commercial queries.
The quarter therefore provides no immediate evidence that generative AI is destroying Search demand. Alphabet is currently growing Search while introducing more AI functionality.
Google Services revenue increased 11% to $96.3 billion, while operating income rose approximately 17% to $39.2 billion. Its implied operating margin expanded from approximately 38.5% to 40.7%.
However, usage growth does not completely settle the long-term question.
AI-generated answers require more computing resources than traditional searches. Investors still need to determine whether Alphabet can preserve advertising conversion, revenue per commercial query and operating margins after accounting for those higher costs.
Gemini Has Reached One Billion Users
Alphabet reported that the Gemini app reached one billion users, making it the fastest-growing product in the company’s history.
First-party model APIs were processing nearly 32 billion tokens per minute, more than four times the prior-year level.
This provides strong evidence of adoption. But usage is not yet the same as shareholder return.
Alphabet must convert that reach into incremental subscriptions, advertising, commercial Search activity, enterprise API consumption and Cloud revenue. It must also ensure that the resulting revenue exceeds the cost of models, computing capacity, energy and product development.
The question is no longer whether Alphabet can attract AI users. Q3 suggests that it can.
The harder question is how much recurring profit and free cash flow each new layer of usage will generate.
AI Investment Is Consuming More Cash
Capital expenditure reached $51.4 billion, compared with $24.0 billion one year earlier and $44.9 billion in Q2.
Capex represented approximately 40% of quarterly revenue and exceeded operating cash flow of $42.3 billion.
Free cash flow therefore deteriorated from negative $5.9 billion in Q2 to negative $9.1 billion in Q3.
Trailing-12-month free cash flow fell to approximately $19.7 billion, even though Alphabet generated $179.6 billion of operating cash flow over the period.
The divergence is increasingly important:
- Revenue and operating income continue growing.
- Google Cloud is becoming highly profitable.
- Operating cash flow remains substantial.
- Capital expenditure is growing even faster.
- Free-cash-flow conversion is deteriorating.
This does not prove that Alphabet is overspending. Infrastructure normally must be built before it produces its full economic contribution.
But shareholders still need evidence that future cash flows will exceed the capital, depreciation, energy and financing costs required to produce them.
Capital Allocation Has Fundamentally Changed
During the first nine months of 2026, Alphabet raised:
- $42.9 billion through common-equity issuance
- $19.1 billion through mandatory-convertible preferred stock
- $85.2 billion through debt issuance
Alphabet repurchased no common shares during the same period.
During Q3 alone, it issued 36 million Class A and Class C shares for net proceeds of approximately $12.4 billion. It also raised approximately $29 billion through debt issuance.
Diluted weighted-average shares increased approximately 1.4% year over year, while quarterly interest expense rose from $143 million to $967 million.
Alphabet retains considerable liquidity, with $265.1 billion of cash, cash equivalents and marketable securities. But it also carries $125.1 billion of long-term debt and $18.0 billion of mandatory-convertible preferred equity.
For a company historically known for enormous excess cash generation and aggressive repurchases, this represents a meaningful change.
The financing may prove rational if the infrastructure produces attractive long-term returns. If it does not, existing shareholders will have absorbed weaker cash conversion, higher financing costs and dilution.
Alphabet SWOT Analysis
Alphabet’s Q3 results strengthen the AI-growth thesis while increasing the uncertainty surrounding the value of that growth.
The percentage ranges below estimate each factor’s potential effect on fair value relative to neutral assumptions. They are scenario sensitivities rather than short-term price predictions and should not be added together because several factors overlap.
Strengths
Google Cloud has become a large and highly profitable growth engine.
Cloud revenue increased 103%, operating income more than tripled and implied operating margin reached approximately 36.2%.
If Cloud sustains materially stronger growth and profitability than assumed in our base case, the estimated fair-value benefit could be approximately 10% to 18%.
Search remains commercially resilient.
Search revenue increased 12%, while management reported its fastest query growth in five years. Google Services also expanded its operating margin.
If Search continues growing at a low-double-digit rate while maintaining a margin around 40%, the estimated fair-value benefit could be approximately 5% to 10%.
Alphabet retains substantial financial capacity.
Cash, equivalents and marketable securities exceeded long-term debt and mandatory-convertible preferred equity by approximately $122 billion.
This represents about $9.90 per outstanding share and provides financial flexibility during the infrastructure buildout. The estimated fair-value contribution is approximately 3% to 5%.
Weaknesses
Capital expenditure has overtaken operating cash generation.
Quarterly capex reached 40% of revenue and exceeded operating cash flow by approximately $9.1 billion.
If sustainable owner earnings remain $40 billion to $60 billion below the level suggested by operating profit, the estimated fair-value impact could be approximately negative 12% to negative 20%.
Growth is being financed through new claims on future earnings.
Alphabet has issued common shares, preferred stock and debt while repurchasing no shares. Dilution, preferred dividends and higher interest expenses reduce the value accruing to existing common shareholders.
The estimated fair-value impact could be approximately negative 4% to negative 9%.
Shared AI research and Other Bets are absorbing more profit.
Alphabet-level expenses and Other Bets produced a combined operating drag of approximately $9.7 billion, compared with $5.9 billion one year earlier.
If these expenses continue growing without proportionate monetization, the estimated fair-value impact could be approximately negative 5% to negative 9%.
Opportunities
Gemini has reached monetizable consumer scale.
With one billion users, even modest subscription, advertising or commercial-query monetization could become financially meaningful.
Successful conversion of this reach into incremental high-margin revenue could add approximately 5% to 12% to fair value.
Cloud and TPU sales could broaden Alphabet beyond advertising.
Cloud represented approximately 24% of quarterly revenue, compared with about 15% one year earlier. TPU-system sales provide another channel for monetizing Alphabet’s AI technology.
If Cloud eventually settles at 30% to 40% annual growth while maintaining a margin around 35%, the estimated fair-value opportunity could be approximately 10% to 18%.
Free cash flow could rebound when infrastructure growth normalizes.
If operating cash flow continues growing while capex eventually stabilizes, a substantial portion of incremental cash could reach shareholders.
A decline in capex intensity from approximately 40% of revenue toward 25% to 30% could add approximately 12% to 20% to fair value.
Threats
AI could expand Search usage while weakening its economics.
More queries do not necessarily guarantee equivalent advertising conversion, revenue per query or cost efficiency.
A three-to-five-percentage-point decline in Google Services margin could materially reduce consolidated earnings. The estimated fair-value impact could be approximately negative 10% to negative 18%.
AI infrastructure may produce inadequate returns on capital.
Property and equipment increased by approximately $126 billion during the first nine months of 2026. These assets will create higher depreciation, energy, maintenance and financing costs even if future demand disappoints.
If the infrastructure earns returns below Alphabet’s cost of capital, the business could continue growing while intrinsic value per share stagnates. The estimated fair-value impact could be approximately negative 12% to negative 20%.
Further financing could become increasingly expensive.
Alphabet still had $27.6 billion available under its at-the-market equity programme after Q3.
Additional issuance following the share-price decline would require more shares to raise the same amount of capital. Further debt would increase interest expense.
The estimated fair-value impact could be approximately negative 5% to negative 12%.
Alphabet Valuation Scenarios
Alphabet’s reported EPS cannot be valued directly because investment gains and losses created substantial volatility.
After removing the company-disclosed EPS effects from equity securities over the latest four quarters, we estimate trailing normalized earnings power of approximately $10.95 per share.
We also include a conservative net-financial-asset adjustment of $10 per share. This deducts long-term debt and mandatory-convertible preferred equity from cash and marketable securities.
Non-marketable investments are excluded because their valuations are volatile.
Bear Case: $210 per Share
The bear case assumes:
- Forward normalized EPS of $10.00
- A valuation multiple of 20 times earnings
- Net financial assets of $10 per share
- A 30% scenario probability
The calculation is:
$10.00 × 20 + $10 = $210
This scenario assumes that Search growth slows, AI serving costs pressure Google Services margins and Cloud growth normalizes sharply.
Higher depreciation, interest expense, preferred dividends and shared AI research constrain recurring earnings. Capital expenditure remains elevated, while equity or debt issuance continues.
A 20-times multiple recognizes the quality of Alphabet’s established businesses but reflects its greater capital intensity and uncertain free-cash-flow conversion.
Base Case: $310 per Share
The base case assumes:
- Forward normalized EPS of $12.00
- A valuation multiple of 25 times earnings
- Net financial assets of $10 per share
- A 50% scenario probability
The calculation is:
$12.00 × 25 + $10 = $310
Forward EPS of $12 represents growth of approximately 9.6% from the normalized trailing base.
This is deliberately much lower than Q3’s 30% operating-income growth. Higher depreciation, financing expenses, preferred dividends and dilution could prevent the full operating improvement from reaching common shareholders on a per-share basis.
The 25-times multiple recognizes Alphabet’s strong competitive position, Search resilience, Cloud acceleration and Gemini adoption. It also incorporates the unresolved weakness in free-cash-flow conversion.
Bull Case: $430 per Share
The bull case assumes:
- Forward normalized EPS of $14.00
- A valuation multiple of 30 times earnings
- Net financial assets of $10 per share
- A 20% scenario probability
The calculation is:
$14.00 × 30 + $10 = $430
This scenario requires more than continued AI adoption.
Search must remain economically resilient, Cloud must sustain strong growth and margins, Gemini must generate meaningful incremental revenue, and TPU-system sales must develop into a durable business.
Most importantly, infrastructure investment must begin producing attractive returns, allowing capital intensity to normalize and free cash flow to recover.
Probability-Weighted Fair Value
Applying the assigned probabilities produces:
- Bear case: 30% × $210 = $63
- Base case: 50% × $310 = $155
- Bull case: 20% × $430 = $86
The combined probability-weighted value is:
$63 + $155 + $86 = $304
Our updated fair-value estimate is therefore approximately $304 per share.
This is $20, or approximately 6.2%, below our previous Q2 estimate of $324.
The reduction does not reflect a weaker operating business. Q3 strengthened the evidence supporting Cloud, Search and Gemini.
The valuation declined because capital expenditure increased again, free cash flow deteriorated, external financing continued and the business became more capital intensive.
What to Watch Next
The most important indicators for the next several quarters are:
- Search revenue growth and commercial-query monetization
- Google Services operating margin
- Google Cloud growth and operating margin
- Gemini conversion from usage into revenue
- TPU-system sales and profitability
- Capital expenditure as a percentage of revenue
- Operating-cash-flow growth
- Free-cash-flow recovery
- Depreciation and shared AI research expenses
- Further common-share issuance
- Debt and interest expense
- Any resumption of share repurchases
What matters more to your Alphabet thesis: Google Cloud’s extraordinary growth or the continuing deterioration in free-cash-flow conversion?
Share your view in the comments, and follow SWOTstock for more independent earnings analysis based on company-reported evidence.
Disclaimer: This article is for informational and educational purposes only and does not constitute financial advice or a recommendation to buy or sell any security. The normalization adjustments, valuation multiples, scenario probabilities and fair-value estimates are analytical judgments based on stated assumptions and may differ materially from actual outcomes. Investors should conduct their own research and consider their objectives, financial circumstances and risk tolerance before making investment decisions.

