TL;DR Summary
Adobe (NASDQ: ADBE) closed FY2025 with another strong quarter: revenue rose 10% YoY to $6.19B, ARR surpassed $25B, and AI features across Creative Cloud and Document Cloud continued driving higher engagement. Yet the stock slipped just –0.8% after hours, reflecting investor expectations for stronger AI monetization and cautious sentiment around the $1.9B Semrush acquisition. Adobe remains a premium-quality subscription business, and our fair value stands at $520, supported by durable ARR growth, strong free cash flow, and early—but accelerating—AI upside.
Quarter Recap
Adobe reported its Q4 FY2025 results on December 11, highlighting a company that continues to compound ARR while transitioning deeper into AI-enhanced creative and productivity workflows. Revenue grew 10% YoY to $6.19B, beating expectations, and non-GAAP EPS came in at $5.50. Digital Media ARR and Document Cloud momentum remained strong, and Experience Cloud delivered stable growth ahead of planned integration with Semrush. Free cash flow reached $3.16B for the quarter and over $10B for the full year.
Despite the strong numbers, Adobe’s share price slipped approximately 0.8% after hours. This muted reaction was driven by high expectations, the need for clearer AI monetization signals, and continued caution around software multiples during a volatile macro backdrop.
Key Highlights
- Revenue of $6.19B, up ~10% YoY; above consensus.
- Non-GAAP EPS of $5.50; exceeded analyst expectations.
- Digital Media and Document Cloud ARR both saw solid double-digit growth.
- Free cash flow reached $10B+ for FY25 — reinforcing balance sheet strength.
- AI adoption continued accelerating across Creative Cloud and Acrobat.
- Announced $1.9B acquisition of Semrush to deepen Experience Cloud capabilities.
- FY2026 guidance targets ~10%+ ARR growth, with expanding AI-driven workflows.
SWOT Analysis
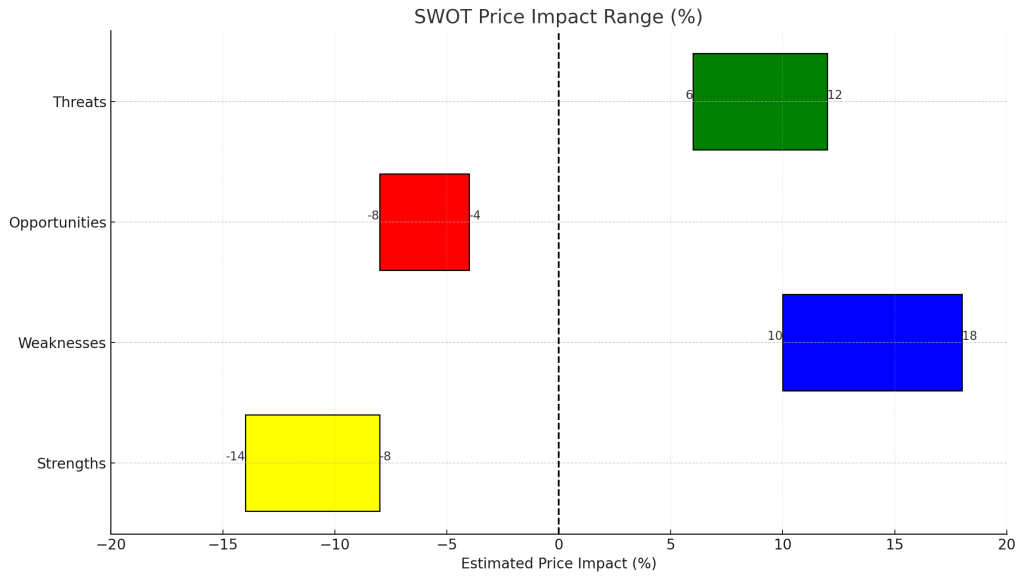
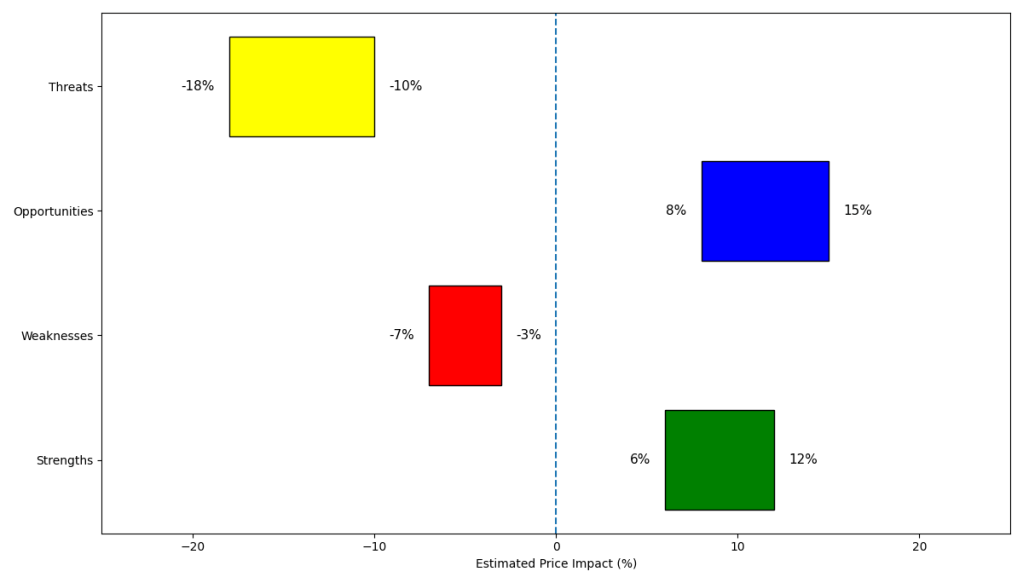
Adobe enters FY2026 with solid momentum, supported by durable ARR, growing AI adoption, and strong cash generation. Still, the market remains cautious as it weighs valuation, competition, and the pace of AI monetization. Below is a clear, investor-ready SWOT with quantitative price impacts.
Strengths (+6% to +12%)
- Record ARR growth across Creative Cloud, Document Cloud, and Experience Cloud reinforces subscription durability.
- AI tools such as Firefly and Acrobat AI Assistant deepen product engagement and increase switching costs.
- Robust free cash flow provides flexibility for buybacks and acquisitions.
- Consistent revenue and EPS beats reflect disciplined execution.
Weaknesses (–3% to –7%)
- Premium valuation multiples make the stock sensitive to any growth deceleration.
- AI monetization still lacks explicit revenue attribution, creating uncertainty.
- Experience Cloud faces rising competition in enterprise marketing and analytics.
- Muted stock reaction shows investor expectations were already high.
Opportunities (+8% to +15%)
- Monetization of Firefly and enterprise AI workflows can drive incremental ARR.
- Acrobat AI Assistant is positioned to become a major enterprise productivity catalyst.
- Semrush integration offers new cross-sell and retention opportunities in Experience Cloud.
- AI-driven automation may support future price increases and margin expansion.
Threats (–10% to –18%)
- Competitive pressure from Canva, Figma, and emerging AI-native design tools.
- Slowing enterprise budgets could affect Experience Cloud bookings.
- Regulatory scrutiny around AI training and creative rights could create material risk.
- If AI momentum does not translate into revenue, valuation multiples may compress.
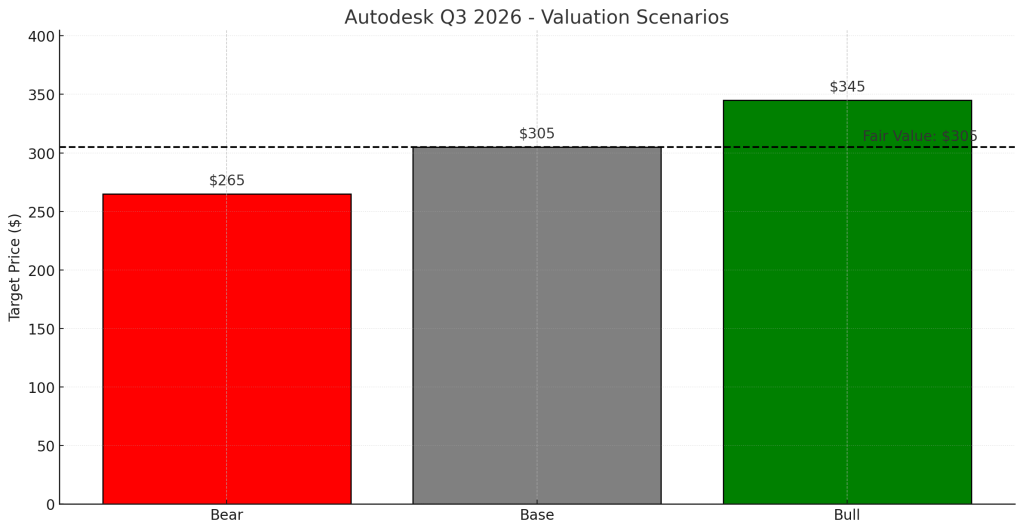
Valuation Scenarios
Adobe’s valuation hinges on ARR durability, AI monetization success, and execution in Experience Cloud. Here are the scenario-based outcomes and how each target is derived.
Bear Case — $455 (25% probability)
- ARR growth slows below 10%.
- AI engagement does not translate into meaningful pricing expansion.
- Experience Cloud bookings lag amid cautious enterprise spending.
- EPS multiple contracts toward ~18× forward earnings.
Base Case — $525 (50% probability)
- ARR grows ~10%+ inline with FY26 guidance.
- AI features deliver moderate, steady uplift to engagement and retention.
- Semrush integration supports Experience Cloud without margin drag.
- EPS multiple stabilizes around ~20–22×.
Bull Case — $580 (25% probability)
- Firefly, Acrobat AI Assistant, and enterprise workflows accelerate AI monetization.
- Creative Cloud pricing power increases with minimal churn.
- Semrush drives stronger-than-expected Experience Cloud expansion.
- EPS multiple expands toward ~24–25×.
Probability-Weighted Fair Value
= (0.25 × 455) + (0.50 × 525) + (0.25 × 580)
= ~$520 per share

Verdict
Adobe’s Q4 results reaffirm the strength of its subscription engine and show that AI adoption is meaningfully increasing engagement. Yet investors are demanding clearer proof of monetization before rewarding the stock with higher multiples. For Type 1 tech-savvy growth investors, Adobe remains a high-quality compounder with manageable execution risk, strong cash flow, and emerging AI tailwinds. At around $520 fair value, the stock appears reasonably priced relative to forward fundamentals.
Call to Action
If you want deeper earnings-season insights, follow SWOTstock for clear, fact-based analysis built directly from official reports and transcripts. No noise, no hype — just the truths that matter for long-term investors.
Disclaimer
This analysis is for informational purposes only and is not financial advice. All conclusions are based solely on Adobe’s official filings and earnings call commentary.