Palantir Q1 2025 Earnings Recap: Big Numbers, Big Valuation?

Palantir reported strong Q1 2025 earnings with revenue up 39% and solid profits, yet its stock dropped 8%, raising concerns about valuation. While the company shows strengths in commercial growth and AI traction, weaknesses stem from reliance on government contracts. The stock appears overvalued, reflecting potential regulatory and competitive threats.

Palantir (NASDAQ: PLTR) dropped a strong Q1 2025 earnings report. Revenue was up, profits were solid, and its AI platform (AIP) is gaining traction. But even with all the good news, the stock dropped 8% after earnings. So… what gives?

Well, it might be less about the business—and more about the price. Let’s break it down, in plain English.


📊 Quick Q1 2025 Snapshot

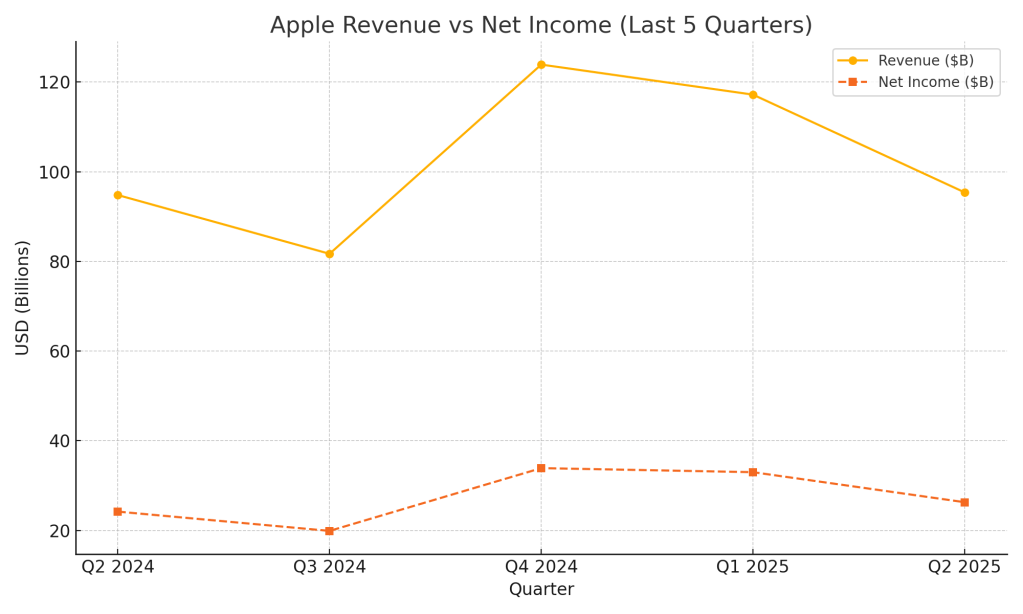
  • Revenue: $634M (+39% YoY)
  • U.S. Commercial Revenue: $255M (+71% YoY)
  • Net Income: $214M
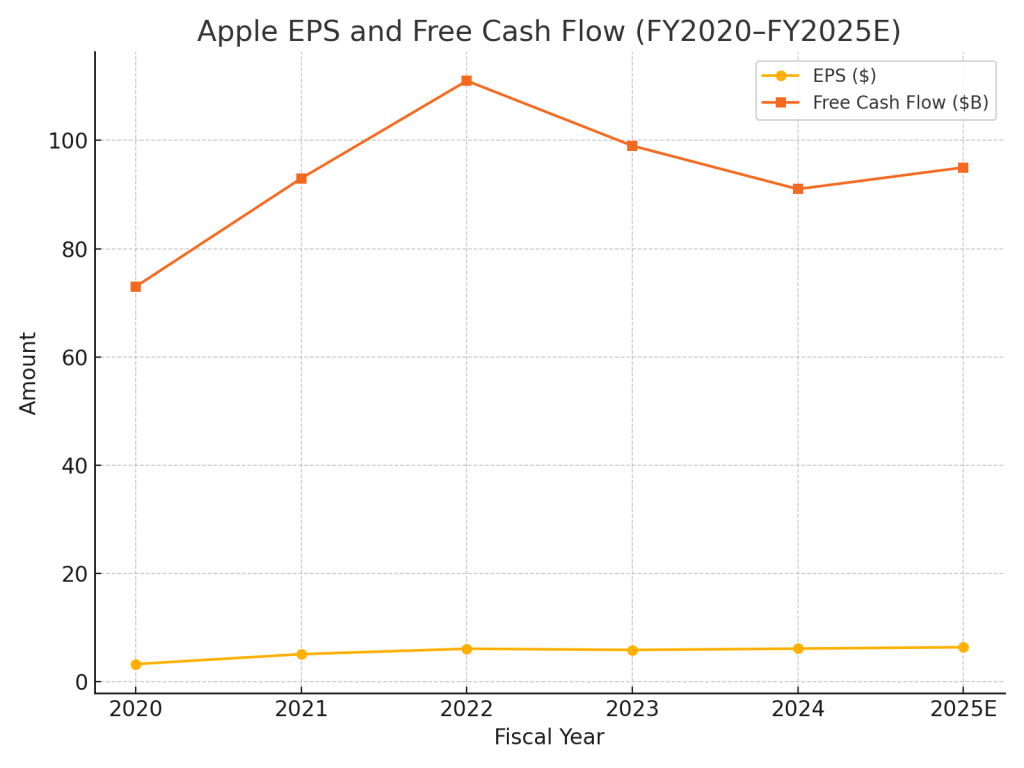
  • Free Cash Flow (FCF): $441M (42% margin)
  • Big Contracts (>$10M): Up 73%
  • Customer Count: Up 39% YoY
  • Stock reaction: −8% after earnings

Palantir’s business is clearly growing, but investors are now wondering if the current stock price has already priced in too much future success.


🧠 SWOT Analysis: Strengths, Weaknesses, Opportunities, Threats

Let’s run through a full SWOT breakdown—plus what each factor means for the stock’s value.


✅ Strengths: Commercial Business on Fire

Palantir’s commercial segment (especially in the U.S.) is growing like crazy. They’re moving beyond defense and government, and they’re finally generating serious free cash flow.

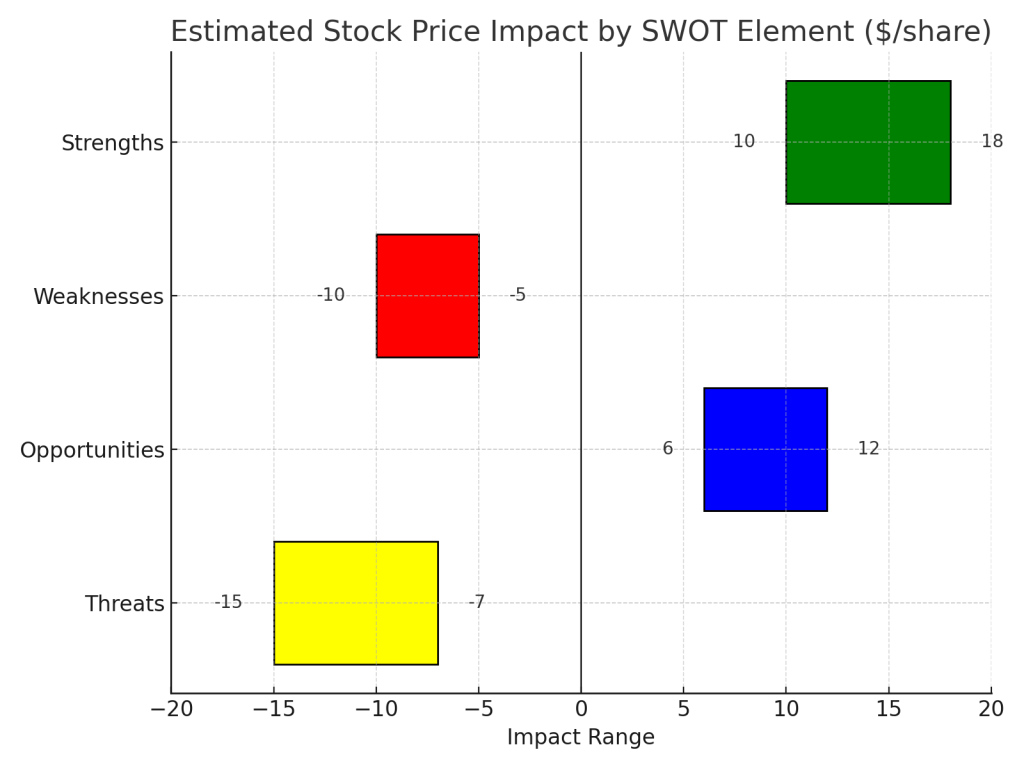
📈 Valuation Impact: +32%
We estimated that if this growth holds, it adds about $24 per share to fair value. This is based on raising long-term FCF assumptions and applying a ~30x FCF multiple to commercial earnings.

  • U.S. commercial revenue up 71%
  • High-margin, cash-generating operations
  • Expanding large enterprise footprint

❌ Weaknesses: Still Relying on Government

Half the business still depends on U.S. government contracts. That’s stable… until it’s not. Also, Palantir’s international revenue isn’t keeping up, and that limits its global reach.

📉 Valuation Impact: −15%
This knocks $11 off fair value by capping international growth and assigning a lower multiple to defense-related revenue.

  • Heavy reliance on U.S. federal contracts
  • Global growth is slow
  • Business model less diversified than peers

🚀 Opportunities: AI Enterprise Boom

Palantir is well-positioned to ride the enterprise AI wave. AIP is getting traction, and the company is now partnering with cloud players like AWS to reach more customers, faster.

📈 Valuation Impact: +18%
This adds ~$13 to fair value, assuming they grow revenue at a 25% CAGR over the next 5 years in the commercial AI segment.

  • AI use cases expanding fast
  • Partnerships make scaling easier
  • Total addressable market is huge and growing

⚠️ Threats: Big Tech Competition, Regulation

Google, Microsoft, Amazon—all building their own enterprise AI tools. Plus, Palantir still faces scrutiny over its military/government work, which could lead to reputational or regulatory challenges.

📉 Valuation Impact: −18%
We subtracted ~$13 from fair value assuming increased sales competition and legal friction reduces margin and contract growth.

  • Big tech is moving in
  • Regulatory/political risks
  • Defense-related perception issues persist

📊 Valuation: What’s the Stock Worth?

We pulled all the SWOT impacts together to estimate a fair value:

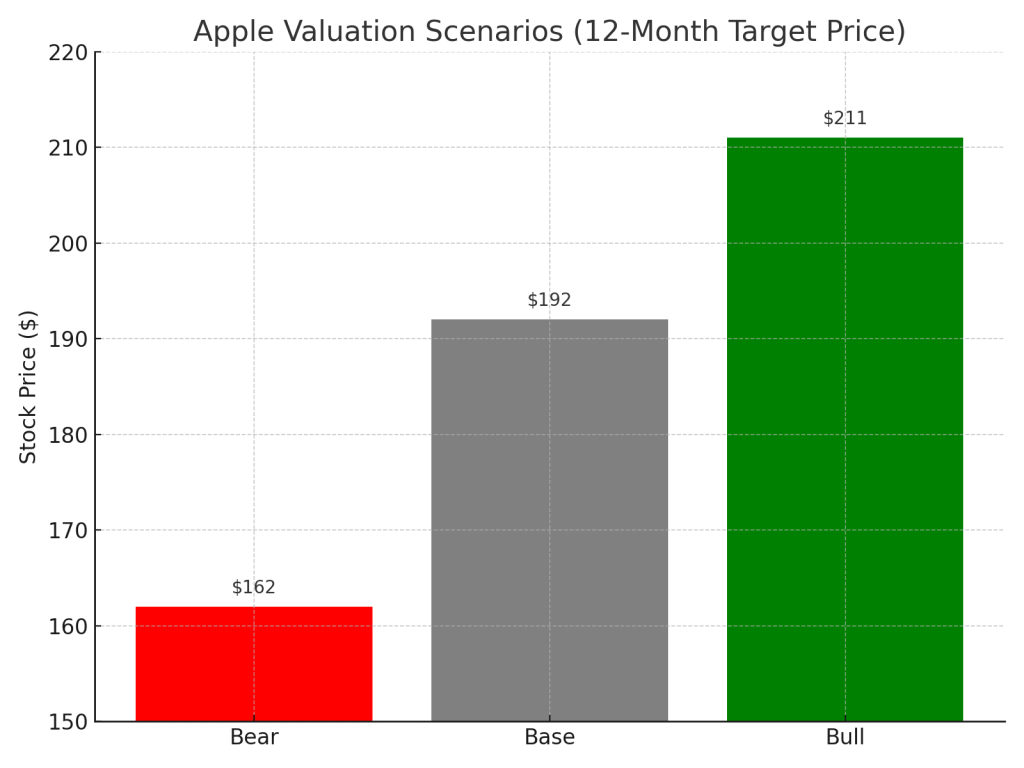
  • Base Case Fair Value: ~$88
  • Bull Case (faster commercial + AI wins): ~$110
  • Bear Case (slow adoption + regulatory issues): ~$65
  • Current Price: ~$124

👉 Conclusion: The stock looks about 30% overvalued right now based on fundamentals and growth assumptions. It’s a great company, but the market might be pricing in perfection.


💡 Final Take

Palantir is clearly executing well. Their AI platform is getting adopted, they’re profitable, and they’re building momentum in the commercial space. But the stock might be a bit ahead of itself right now.

If you’re in it for the long haul and believe in Palantir’s AI vision, it might still be worth holding. But if you’re looking to start a position, it could make sense to wait for a pullback.


📌 Disclaimer & Final Notes

This analysis is based solely on official company disclosures—including Palantir’s Q1 2025 financial report, earnings call transcript, and direct management commentary. No third-party commentary or speculative sources were used.

Please note that this content is for informational purposes only and does not constitute investment advice. Always do your own research or consult a licensed financial advisor before making investment decisions.

📬 Want more no-nonsense breakdowns of AI stocks and earnings?
Subscribe to stay updated with the latest earnings summaries, fair value estimates, and plain-language analysis—tailored for everyday investors who want to stay sharp.


One response to “Palantir Q1 2025 Earnings Recap: Big Numbers, Big Valuation?”

  1. NVIDIA Q1 FY2025: AI Boom Powers Revenue—but Is the Stock Already Fully Priced? – SWOT Stock – Smart Investing Made Simple Avatar

    […] check out our recent breakdowns of AMD Q1 2025, Palantir Q1 2025, Meta Q1 2025 and Alphabet Q1 2025 for more actionable […]

    Like

Leave a comment

Airbnb Q1 2025 Earnings Analysis: Strategic Growth Amidst Market Dynamics

Airbnb’s Q1 2025 earnings showed revenue growth of 6% year-over-year, reaching $2.27 billion, despite a decline in net income to $154 million due to increased compensation and write-downs. Strong bookings, particularly in Latin America and Asia Pacific, drove performance. Looking ahead, revenue growth is projected at 12-14% for Q2.

Airbnb (NASDAQ: ABNB) reported its Q1 2025 earnings on May 1, 2025, highlighting steady growth in bookings and revenue, alongside strategic investments aimed at long-term expansion.


📅 Airbnb Q1 2025 Recap

Airbnb delivered a solid Q1 2025, marked by steady growth in bookings and resilient financial performance, despite macroeconomic headwinds. The company reported $2.27 billion in revenue, reflecting 6% year-over-year growth, which would have been approximately 11% on a constant-currency and calendar-adjusted basis. Although net income fell to $154 million (from $264 million a year ago), this was largely due to higher stock-based compensation, write-downs on investments, and lower interest income. Importantly, free cash flow reached a record $1.8 billion, driven by strong seasonality and healthy booking trends.

Operationally, nights and experiences booked rose 8% year-over-year to 143 million, with Gross Booking Value (GBV) up 7% to $24.5 billion. Growth was driven particularly by strength in Latin America (low 20s%) and Asia Pacific (mid-teens%), while North America showed more modest gains. Airbnb also returned value to shareholders through $807 million in stock repurchases, reducing its diluted share count to 660 million.

Management emphasized ongoing investment in product innovation—such as pricing transparency tools and improved communication features—to drive long-term differentiation. Looking forward, Q2 guidance anticipates ~12–14% revenue growth with stable ADRs, reflecting a cautious but optimistic outlook heading into the summer travel season.


📊 Q1 2025 Financial Highlights

  • Revenue: $2.27 billion, a 6% increase year-over-year. Adjusted for foreign exchange and calendar effects, revenue growth would have been approximately 11%.
  • Net Income: $154 million, down from $264 million in Q1 2024, primarily due to higher stock-based compensation, investment write-downs, and lower interest income.
  • Adjusted EBITDA: $417 million, representing an 18% margin.
  • Free Cash Flow: $1.8 billion, with a trailing twelve-month free cash flow of $4.4 billion.
  • Nights and Experiences Booked: 143 million, an 8% increase year-over-year.
  • Gross Booking Value (GBV): $24.5 billion, up 7% year-over-year.
  • Share Repurchases: $807 million in Q1 2025, reducing the fully diluted share count from 677 million to 660 million.

📞 Earnings Call Summary

During the earnings call, CEO Brian Chesky and CFO Ellie Mertz discussed several key points:

  • Regional Performance:
    • North America: Low single-digit growth in nights booked, indicating market maturity.
    • EMEA: Mid-single-digit growth in nights booked.
    • Latin America: Low-20s percentage growth in nights booked, with Brazil showing a 27% increase.
    • Asia Pacific: Mid-teens percentage growth in nights booked.
  • Product Development: Continued investment in enhancing the booking experience, including pricing transparency and guest-host communication tools.
  • Market Trends: Noted a shift in Canadian travelers opting for destinations like Mexico over the U.S., attributed to economic uncertainties and changing travel preferences.

🧭 SWOT Analysis with Stock Price Impact

With the financial results and key management insights from the earnings call now clear, it’s important to step back and evaluate what these figures mean for Airbnb’s overall strategic position. A SWOT analysis—assessing the company’s strengths, weaknesses, opportunities, and threats—helps put the quarter’s performance into broader context and highlights the factors likely to influence Airbnb’s stock price trajectory in the months ahead.

Strengths (+$10–$15 per share)

Airbnb’s asset-light model continues to generate robust free cash flow ($1.8B in Q1), supporting strategic investments and share repurchases. The company’s global presence and brand recognition contribute to its resilience, potentially adding $10–$15 per share in valuation support.

Weaknesses (−$5–$10 per share)

Slower growth in North America and a slight decline in Average Daily Rate (ADR) suggest market saturation and pricing pressures. These factors may contribute to a $5–$10 per share reduction in valuation.

Opportunities (+$15–$25 per share)

Expanding into emerging markets like Latin America and Asia Pacific, coupled with product innovations, positions Airbnb for future growth. Successful execution could add $15–$25 per share in valuation upside over the next 12–18 months.

Threats (−$10–$20 per share)

Regulatory challenges in key cities and macroeconomic uncertainties, including currency fluctuations and geopolitical risks, pose potential threats. These could lead to a $10–$20 per share downside risk.

📌 SWOT Summary

StrengthsWeaknesses
• Strong free cash flow: $1.8B in Q1, $4.4B TTM – supports reinvestment and buybacks.• Slower growth in North America (low single digits) suggests market saturation.
• Global brand recognition and diversified regional exposure.• ADR declined slightly YoY, indicating pricing pressure or product mix shift.
• High-margin, asset-light business model.• Net income down 42% YoY, partly due to increased stock-based compensation and investment losses.
• Continued product innovation: pricing tools, guest-host features.• FX impact and calendar shifts reduced headline revenue growth.
OpportunitiesThreats
• Rapid growth in Latin America (+20%+) and Asia Pacific (mid-teens%) presents upside potential.• Regulatory challenges in key markets (e.g., city-level restrictions on short-term rentals).
• New tools and enhancements could drive host satisfaction and retention.• Macroeconomic uncertainty impacting travel demand (e.g., Canadian travelers shifting to cheaper destinations).
• Potential to further monetize experiences and expand internationally.• Currency fluctuations and reduced interest income affecting bottom line.
• Share repurchase program enhances EPS over time.• Increased competition from traditional hotels and new platforms.

📈 Valuation Scenarios

With a clear view of Airbnb’s internal strengths and challenges, as well as the external opportunities and risks shaping its strategic landscape, we can now turn to what this all means for investors. By translating the qualitative insights from the SWOT analysis and quantitative performance data into valuation scenarios, we can estimate a reasonable range for the stock’s intrinsic value—under base case, bull case, and bear case assumptions. This helps assess whether Airbnb’s current share price accurately reflects its financial fundamentals and growth outlook.

ScenarioAssumptionsTarget PriceProbability
Base CaseModerate growth with stable margins.$13060%
Bull CaseStrong global travel rebound and successful product roll-outs.$145–$15025%
Bear CaseRegulatory tightening and economic downturns.$105–$11015%

💡 Final Verdict: Is Airbnb Fairly Priced?

At the current price of $125.26 (as of May 2, 2025), Airbnb appears to be fairly priced, reflecting a balance between its growth prospects and potential risks. Investors should monitor regional performance, regulatory developments, and macroeconomic indicators to assess future valuation trajectories.


Comment on Source Usage:
This analysis is based exclusively on Airbnb’s official Q1 2025 financial report and the corresponding earnings call transcript. No third-party news articles, analyst opinions, or external data sources were referenced. This approach ensures the insights presented reflect only the company’s own disclosures and strategic messaging.

Disclaimer:
This content is for informational purposes only and does not constitute financial advice, investment recommendations, or an endorsement to buy or sell any securities. Readers should conduct their own research or consult a qualified financial advisor before making investment decisions.


If you found this analysis helpful and want to stay ahead of key earnings insights, stock valuations, and strategic takeaways from top companies like Airbnb, subscribe now to receive our latest breakdowns straight to your inbox—no noise, just fundamentals.


Leave a comment

Apple Q2 2025 Earnings: Strong Profits, Bigger Buybacks—But Is There Still Long-Term Upside?

Apple’s Q2 2025 earnings show record profits, a $100B buyback, and solid long-term fundamentals. See SWOT analysis, valuation scenarios, and what long-term investors need to know.

What Long-Term Investors Should Take From Apple’s Latest Earnings Report

If you’re building a long-term portfolio, Apple likely has a place in it. But with the stock near $183 and the company posting record earnings in Q2 2025, the question becomes: is Apple still a smart hold—or has most of the upside already been priced in?

Let’s break it down clearly and factually using Apple’s own numbers from its earnings report and investor call.


Consistency You Can Count On: Apple’s Q2 2025 in Context

Apple reported $95.4 billion in revenue, a 5% increase year-over-year, and delivered an EPS of $1.65, up 8%—the highest ever for a March quarter. The company also continued returning capital to shareholders at scale: $29 billion was distributed this quarter through buybacks and dividends.

For long-term holders, this quarter shows why Apple remains one of the most reliable compounders in the market:

  • Services revenue hit a new record at $26.6B, growing 12% YoY.
  • Mac and iPad sales both grew, reversing previous softness.
  • iPhone revenue held steady, up 2%, despite global macro pressures.
  • A new $100 billion buyback program was authorized, further enhancing shareholder value.

These are not flashy numbers—they’re the kind of consistent results that build wealth over time.


Long-Term Growth in Action: What the Last 5 Years Say

Apple’s steady growth is no accident. EPS has grown from $3.28 in FY2020 to an expected $6.40 in FY2025, nearly doubling in five years—despite global challenges.

Free cash flow has remained consistently above $90 billion annually, allowing for uninterrupted buybacks and dividend growth. This consistency is why Apple continues to anchor many long-term portfolios.

Line chart of Apple EPS and free cash flow from fiscal year 2020 to projected 2025, showing consistent financial growth

Key Metrics That Matter

MetricQ2 2025 ResultYoY Change
Revenue$95.4B+5%
EPS$1.65+8%
Free Cash Flow$24BSteady
Services Revenue$26.6B+12%
iPhone Revenue$46.8B+2%
Dividend$0.26/share+4%
Buyback Authorization$100BNew
Line chart showing Apple’s quarterly revenue and net income from Q2 2024 to Q2 2025, highlighting growth trends and profitability patterns

What Could Move the Stock: SWOT Breakdown

Understanding the strengths and risks from Apple’s own disclosures can help investors evaluate where the stock might go from here.

Strengths – Durable Growth and Massive Capital Returns

Apple is a cash machine. Record EPS, strong services performance, and a $100B buyback point to continued shareholder value creation.

Stock Price Impact Estimate: +$10 to +$18

  • Recurring high-margin revenue from services
  • Growing installed base across all regions
  • Buyback program supports share price

Weaknesses – Margin Pressure and Regional Slowdowns

Gross margins dipped this quarter, and revenue in China declined slightly. Wearables also underperformed against last year’s strong launch cycle.

Stock Price Impact Estimate: –$5 to –$10

  • FX and input cost headwinds
  • Gross margin contraction (down 340 bps)
  • Regional weakness in China and wearables

Opportunities – AI, Global Scale, and Supply Chain Shift

Apple Intelligence and Siri upgrades may drive the next hardware upgrade cycle. At the same time, Apple is shifting production for U.S. sales to India and Vietnam to reduce risk.

Stock Price Impact Estimate: +$6 to +12

  • Growth in international services markets
  • Supply chain resilience reduces geopolitical risk
  • New AI features deepen ecosystem loyalty

Threats – Tariffs and Legal Scrutiny

Apple faces $900M in tariff costs in the next quarter and is still navigating legal risks around its App Store practices.

Stock Price Impact Estimate: –$7 to –$15

  • Near-term margin hit from trade policy
  • Long-term impact from regulatory rulings
  • FX volatility in key markets

SWOT Summary

CategoryKey DriversEst. Stock Impact
StrengthsRecord EPS, services growth, $100B buyback+10 to +18
WeaknessesGross margin pressure, China softness–5 to –10
OpportunitiesAI integration, global services, supply chain shift+6 to +12
ThreatsTariffs, legal pressure, FX risks–7 to –15
Apple Q2 2025 SWOT analysis chart showing estimated stock price impact ranges for strengths, weaknesses, opportunities, and threats from -20 to 20 dollars

Valuation Scenarios: What’s the Long-Term Fair Value?

Apple’s fundamentals suggest a forward EPS of $6.40. Using long-term average P/E multiples, here are three valuation outcomes:

ScenarioEPSP/ETarget PriceProbability
Bull6.7531.3$21130%
Base6.4030.0$19250%
Bear6.1026.5$16220%

Weighted Fair Value: ~$191.7/share

Bar chart showing Apple Q2 2025 stock valuation scenarios for bull, base, and bear cases with estimated prices of 211, 192, and 162 dollars

At the current price of ~$183, Apple appears slightly undervalued, with 4–5% upside in the base case. For long-term investors, this aligns with steady, risk-adjusted growth—not hype-driven returns.


Should You Wait for a Better Entry?

At around $183, Apple trades near its weighted fair value of ~$191.7. That suggests limited short-term upside, but not overvaluation.

If you’re building a position or adding, a price closer to $175 may offer a more attractive risk-reward ratio, based on:

  • Base case fair value estimate of $192
  • Recent support levels and volatility range
  • Tariff risks temporarily weighing on sentiment

This doesn’t mean you need to wait—but it provides a disciplined approach if you’re cost-sensitive.


Final Take: Still a Core Holding for Long-Term Portfolios

Apple remains a model of long-term stability. It won’t double overnight, but it doesn’t need to. With strong cash flow, deep ecosystem loyalty, and AI expansion ahead, it’s a smart hold or buy-on-dips candidate for any long-term portfolio.


Want More No-Nonsense Stock Breakdowns?

We focus on what matters: financial results, strategy, and stock implications—without spin.
Subscribe to SWOTstock for clean, clear earnings analysis. Or follow us on Instagram @SWOTstock for mobile-friendly snapshots and updates.


Disclaimer

This blog is based solely on Apple’s official Q2 2025 financial report and earnings call. It is not investment advice. Always evaluate your own risk before investing.


Leave a comment