

TL;DR
Tesla’s Q2 2025 results were mixed: Robotaxi operations are finally live in Austin, and FSD adoption is surging. But vehicle deliveries dropped 14% to ~384,000 units, revenue fell 12%, and free cash flow plunged nearly 90%. At ~$305, our probability‑weighted fair value sits around $323, leaving modest upside if Tesla can deliver on its autonomy and energy ambitions.
Quarter Recap
Tesla reported Q2 2025 revenue of $22.5 B (‑12% YoY) and GAAP net income of $1.2 B. Automotive gross margins improved slightly to 18.2%, but operating margin fell to ~4.1%, and free cash flow dropped nearly 89% to ~$146 M.
Vehicle deliveries declined 14% YoY to ~384,000 units, while production remained flat at ~410,000, underscoring demand and pricing headwinds.
CEO Elon Musk highlighted two milestones:
- Robotaxi pilot launched in Austin, with plans to expand to cover half the U.S. population by year‑end (pending regulatory approvals). Musk indicated that meaningful revenue contributions could start as early as late 2026, assuming regulatory approvals and fleet scaling.
- FSD v12 adoption rose 25–45% in North America, boosting high‑margin software revenue.
Still, Musk cautioned about “a few rough quarters ahead,” reflecting the challenges of balancing growth investments with near‑term profitability.
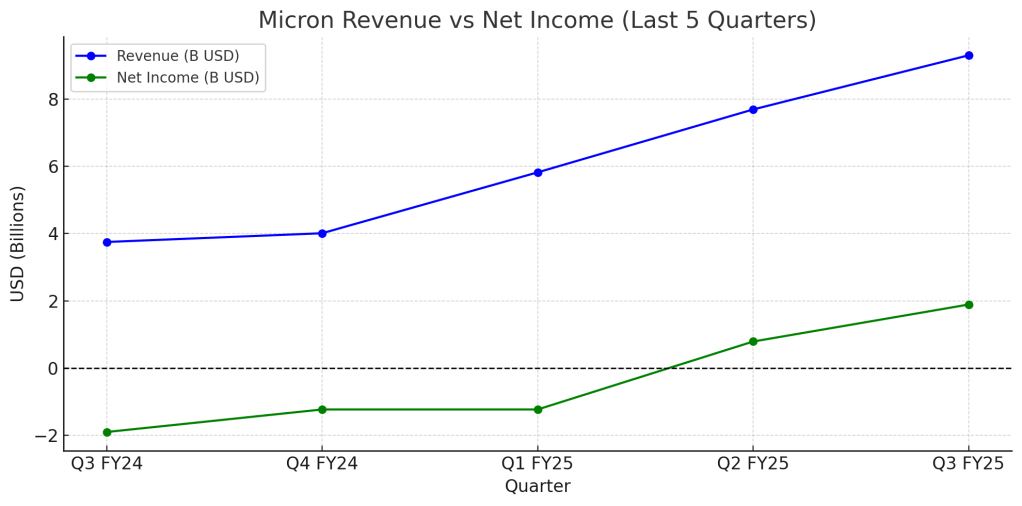
(Visual Placeholder: Revenue vs Net Income for past 5 quarters)
Key Highlights
- Robotaxi Launch: First fleet now live; expansion targeted for late 2025, potential monetization from 2026.
- FSD Momentum: Rapid subscription growth, strengthening recurring revenue.
- Energy Business Surge: Megapack deployments up 45% YoY; revenue for the segment reached an estimated $2.1 B this quarter with backlog through 2026.
- Tariff Impact: CFO confirmed $300 M in added costs this quarter.
- Bitcoin Gain: $284 M recognized, adding balance sheet flexibility.
- Stock Reaction: Shares fell ~8–9% post‑earnings, their sharpest single‑day drop since June, as the market absorbed the weak delivery numbers and Musk’s cautious outlook.

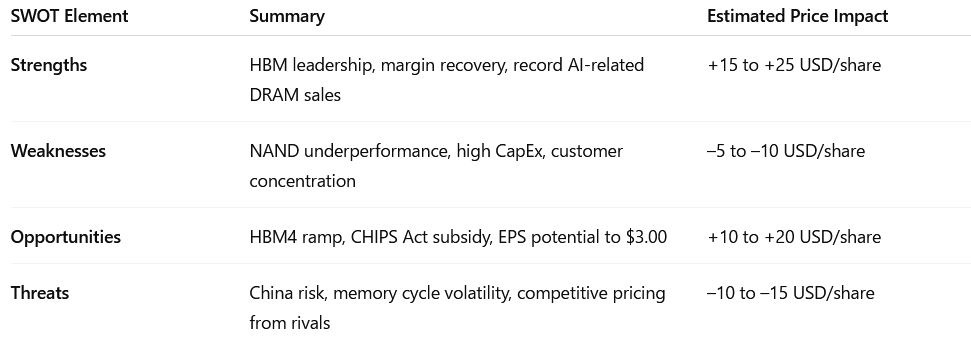
SWOT Analysis: Where Tesla Stands
Strengths (+$25 to +$40/share)
- Robotaxi rollout opens new multibillion‑dollar markets with revenue potential from 2026 onward.
- FSD v12 adoption expanding, locking in software revenue streams.
- Energy storage growth creates a buffer against auto sector volatility.
Weaknesses (‑$15 to ‑$25/share)
- Deliveries fell 14% YoY to ~384,000 units.
- Free cash flow plunged ~89% to ~$146 M; operating margin dropped to ~4.1%.
- Tariff costs and pricing competition dragging margins.
- Heavy reliance on regulatory credits to pad profitability.
Opportunities (+$20 to +$35/share)
- Scaling Robotaxi beyond pilot markets to 5+ metros by 2026.
- AI & robotics (Optimus, Dojo) positioning Tesla beyond auto.
- Megapack and software sales diversifying revenue mix.
Threats (‑$20 to ‑$30/share)
- Intensifying EV competition (BYD, Hyundai, legacy automakers).
- Election‑year tariffs and unpredictable policy changes.
- Musk’s political involvement impacting brand equity, particularly in key U.S. markets.
- Execution risk on autonomy and Robotaxi timelines.

SWOT Summary Table

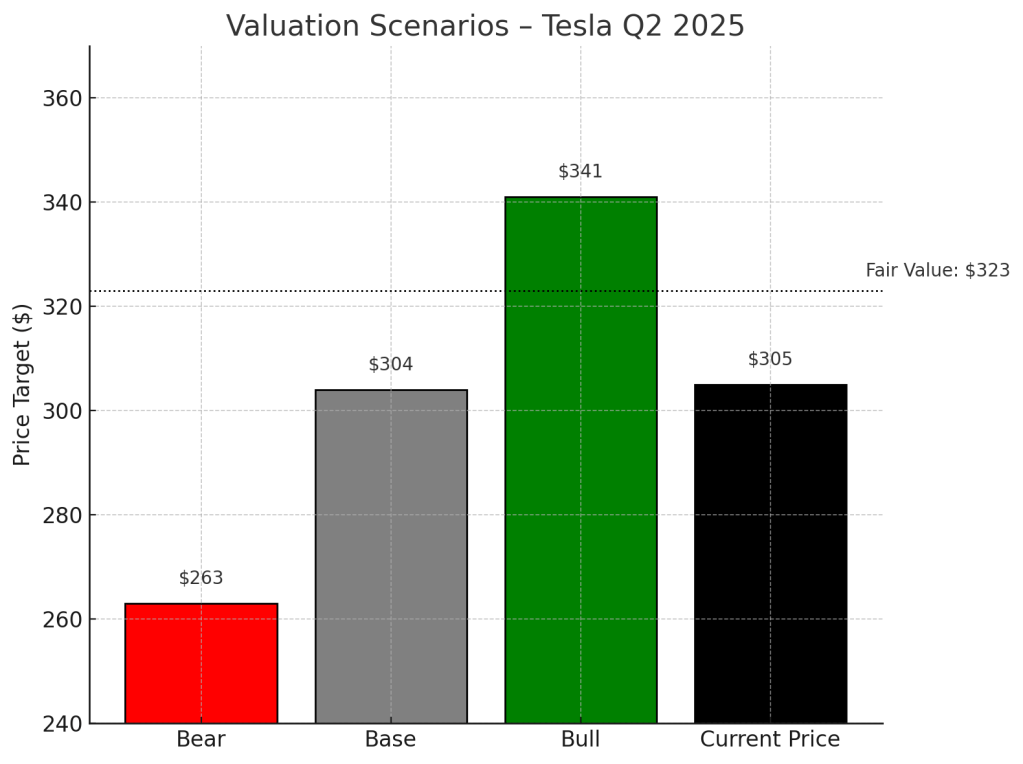
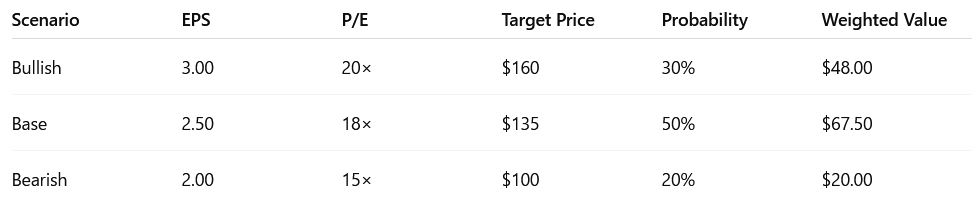
Valuation Scenarios

Weighted fair value:
(0.3×341)+(0.5×304)+(0.2×263)(0.3×341)+(0.5×304)+(0.2×263) = ≈ $323.
Verdict
At ~$305, Tesla trades slightly below our fair value. For tech‑savvy growth investors, this is a measured opportunity— upside hinges on Tesla delivering on its Robotaxi and AI roadmap. Near‑term volatility is likely, but long‑term optionality remains compelling.
For context: Street targets remain widely dispersed, from Barclays’ $275 (neutral to bearish) to Cantor Fitzgerald’s $355–500 (bullish), reflecting high uncertainty about execution and regulatory outcomes. This divergence reinforces our balanced stance: buy on weakness if you believe in autonomy scaling.
Call to Action
Do you see Tesla’s Robotaxi pivot as a true game‑changer? Or is it just another long‑promised milestone? Share your thoughts in the comments and explore our other in‑depth earnings breakdowns at SWOTstock.com.
Disclaimer
This post is for information only and not investment advice. All insights are based on Tesla’s official Q2 2025 financial report, earnings call, and management commentary.


Leave a comment