SoftBank FY2025: Value Play or Value Trap? What Retail Investors Should Know

SoftBank has achieved its first annual profit in four years, posting ¥1.15 trillion for FY2025, driven by Vision Fund 1 gains and an aggressive AI investment strategy. Despite high debt and underperformance from Vision Fund 2, the stock appears undervalued, contingent on the company’s ability to fulfill its ambitious goals.

📊 Quick Take: SoftBank’s Comeback with a Catch

SoftBank (TYO: 9984) just reported its first annual profit in four years, driven by gains in its Vision Fund 1 and a bold AI investment strategy. But Vision Fund 2 is still dragging, and debt remains high. For investors who look at the numbers, the stock looks slightly undervalued—but only if the company delivers on its big promises.


📎 Inside the Numbers: What Drove SoftBank’s FY2025 Profit

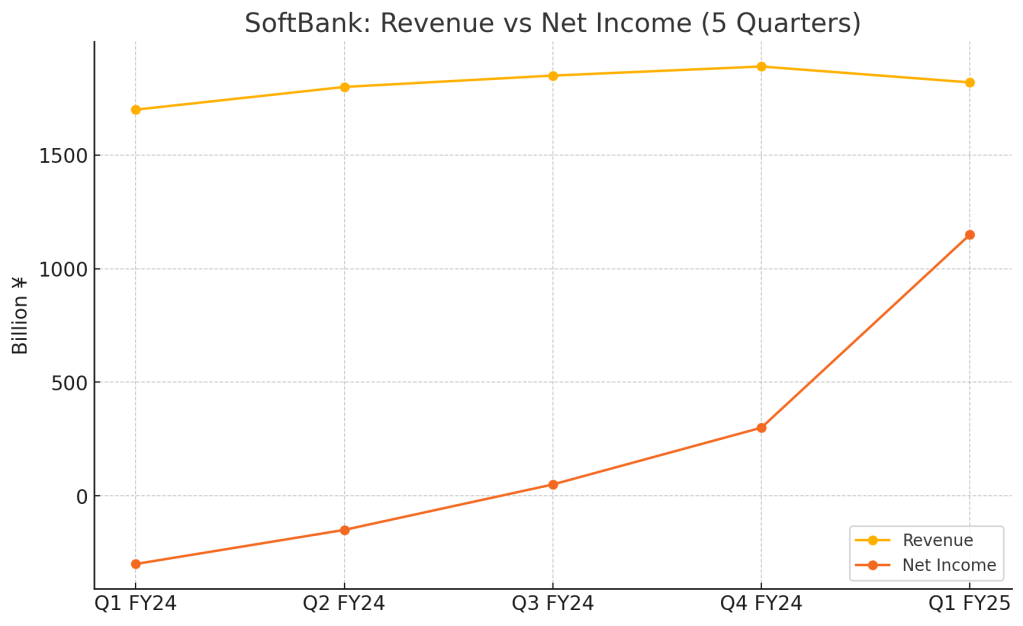
SoftBank Group posted a net profit of ¥1.15 trillion for the fiscal year ended March 31, 2025. This was a sharp turnaround from a ¥227.6 billion loss in the previous year. Revenue came in at ¥7.24 trillion, up 7.2% year-over-year, with Vision Fund 1 showing strong gains thanks to holdings like ByteDance and Coupang.

Management emphasized a shift from defense to offense: investing aggressively in AI and semiconductors. That includes a $6.5 billion acquisition of Ampere and plans to invest up to $40 billion in OpenAI via a syndicated structure.

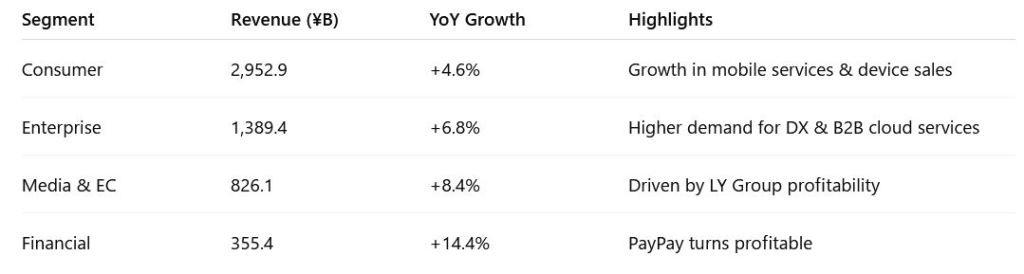
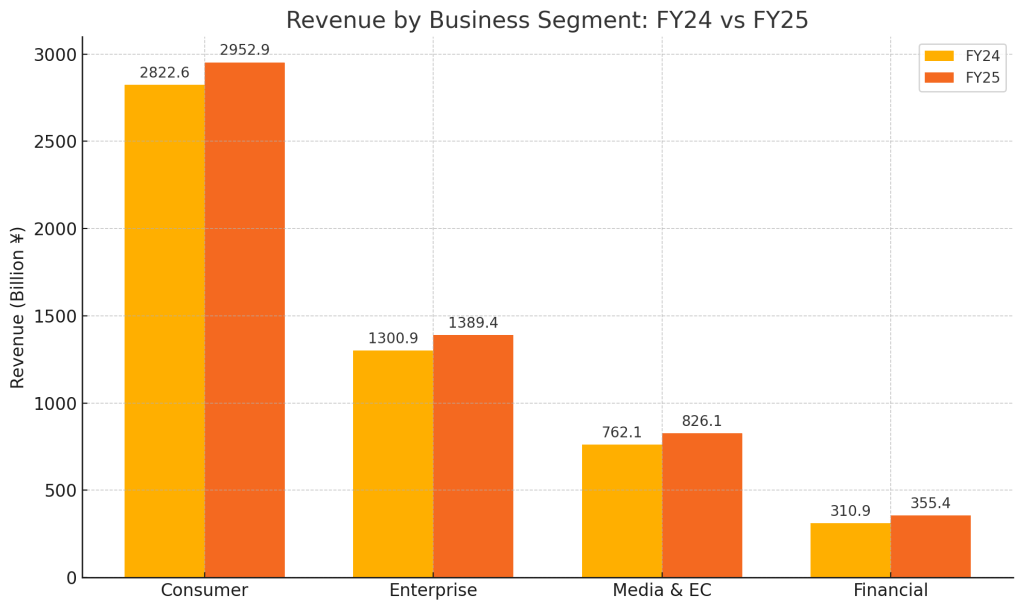
Core segment performance also showed solid growth:

  • Consumer Segment: ¥2,952.9B revenue (+4.6% YoY) — growth in mobile and device sales
  • Enterprise Segment: ¥1,389.4B revenue (+6.8% YoY) — strong digital transformation demand
  • Media & EC: ¥826.1B revenue (+8.4% YoY) — profitability from LY Group
  • Financial Segment: ¥355.4B revenue (+14.4% YoY) — PayPay turned profitable
Table showing SoftBank’s FY2025 revenue by business segment compared to FY2024. Includes Consumer, Enterprise, Media & EC, and Financial segments, highlighting year-over-year growth in billions of yen, with PayPay turning profitable and strong gains in digital services.

Retail investors who like to dig into financials should take note: the company is pivoting hard into high-risk, high-reward territory.

Bar chart comparing SoftBank's revenue by business segment between FY2024 and FY2025, showing year-over-year growth across Consumer, Enterprise, Media & EC, and Financial segments.

✔️ FY2025 Financial Snapshot: Key Metrics

  • Revenue: ¥7.24 trillion (+7.2% YoY)
  • Net Profit: ¥1.15 trillion (vs. ¥-227.6B last year)
  • Operating Income: ¥989 billion (+12.9% YoY)
  • Vision Fund 1: ¥940B gain
  • Vision Fund 2: ¥526B loss
  • Debt: ¥20 trillion gross
  • New Bets: $6.5B Ampere deal, $40B OpenAI initiative
  • Milestone: PayPay turned a profit
Line chart showing SoftBank's quarterly revenue and net income over the past five quarters, highlighting profitability turnaround in FY2025."

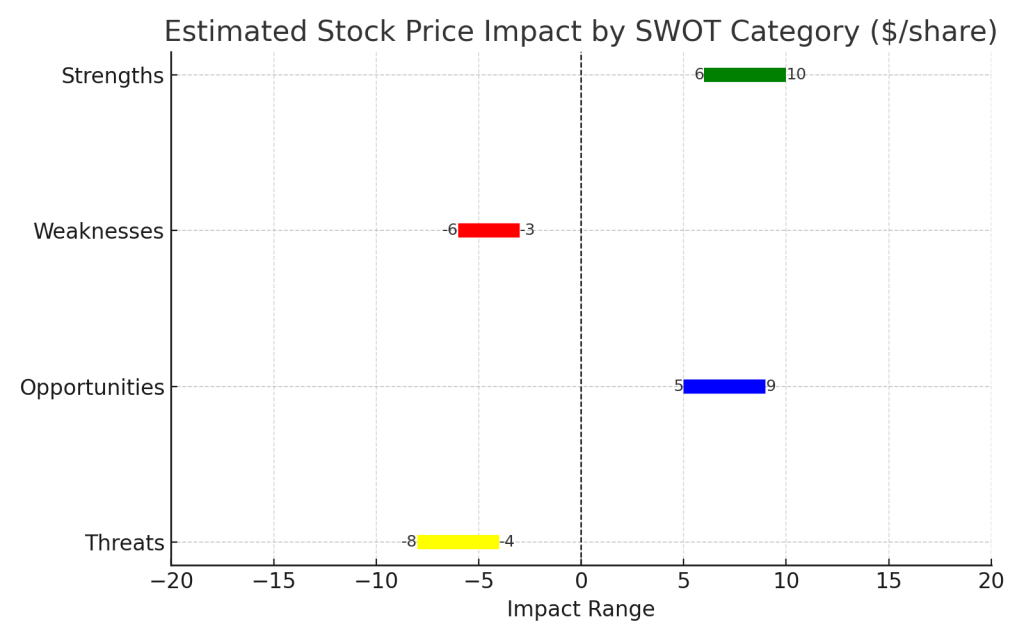
🔄 SoftBank SWOT Breakdown: What Matters for the Stock Price

Let’s look at what’s working, what isn’t, what could go right, and what could go wrong.

Horizontal bar chart illustrating estimated stock price impact ranges for SoftBank based on SWOT analysis: strengths (green), weaknesses (yellow), opportunities (blue), and threats (red).

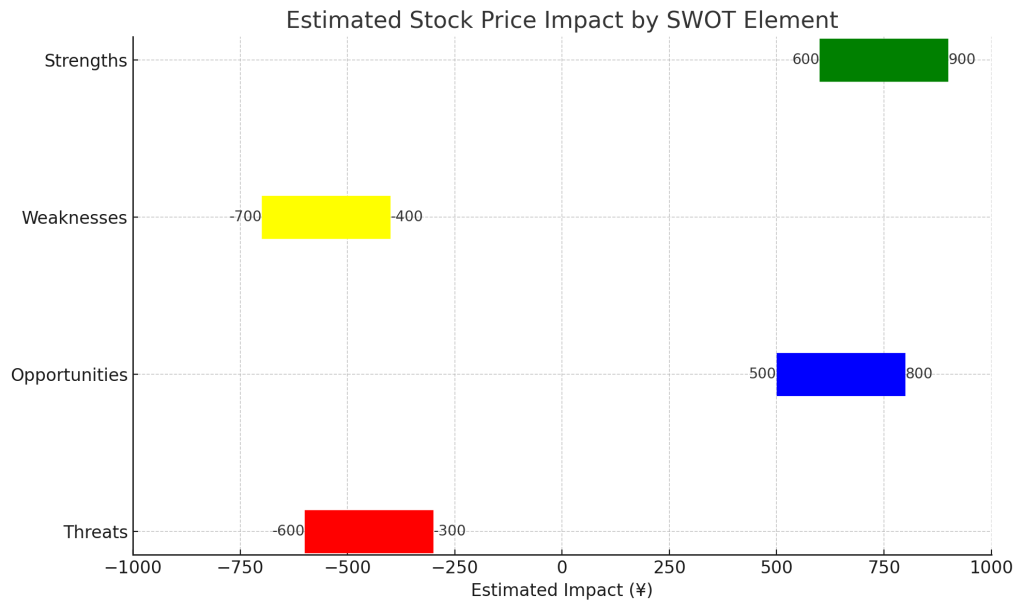
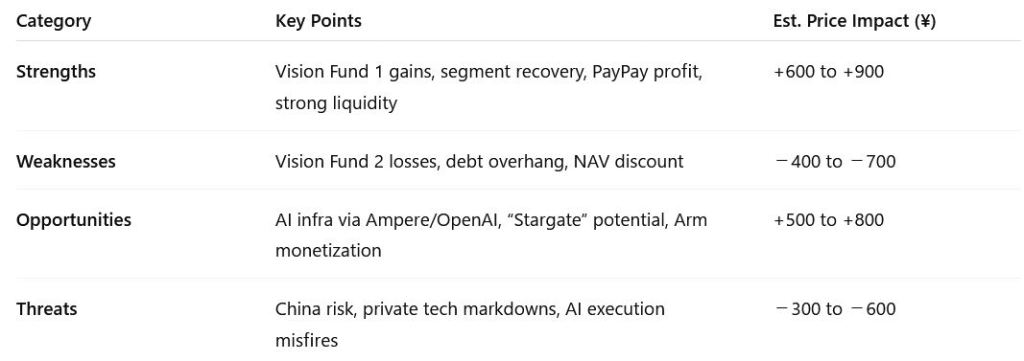
✅ Strengths (Estimated Impact: +¥600 to +¥900/share)

SoftBank’s biggest strength this year is its return to profitability after four years of net losses. The ¥1.15 trillion net income was driven by a rebound in Vision Fund 1, with standout contributions from ByteDance and Coupang. This recovery not only boosts confidence in SoftBank’s asset management capabilities but also reinforces the company’s ability to generate liquidity without resorting to fire-sale asset divestments. Combined with a still-strong balance sheet and monetizable assets like Arm, this foundation supports SoftBank’s ability to take bold bets while weathering downturns. If this profit trend continues and Vision Fund 1 remains stable, the stock could see an upside of ¥600 to ¥900.

❌ Weaknesses (Estimated Impact: –¥400 to –¥700/share)

SoftBank’s structural complexity continues to weigh on investor confidence. Vision Fund 2 posted another ¥526 billion in losses, underscoring ongoing difficulties in picking and scaling private tech companies. Furthermore, SoftBank’s gross debt remains high—hovering around ¥20 trillion—which raises concerns about financial leverage, especially in an uncertain macro environment. Transparency remains a challenge too, with limited visibility into how SoftBank values its private holdings. These factors contribute to a persistent NAV discount and could drag the stock down by ¥400 to ¥700 if not addressed.

🌱 Opportunities (Estimated Impact: +¥500 to +¥800/share)

The company’s aggressive pivot toward AI infrastructure is its most exciting growth lever. Its $6.5 billion acquisition of chip designer Ampere and the $40 billion OpenAI syndicate initiative could position SoftBank as a foundational player in the next generation of AI compute platforms. Additionally, further monetization or appreciation of its Arm stake could catalyze a narrowing of the NAV discount. If these initiatives gain traction—especially if SoftBank manages to translate AI exposure into realized profits—the stock could gain ¥500 to ¥800.

⚠️ Threats (Estimated Impact: –¥300 to –¥600/share)

However, execution risk remains substantial. SoftBank’s exposure to China through holdings like ByteDance continues to invite regulatory and geopolitical scrutiny. A negative revaluation of its private tech holdings—especially in Vision Fund 2—could quickly erode book value. Moreover, AI investments are capital-intensive and long-dated, and success is far from guaranteed. If investor sentiment turns bearish due to underperformance or macro risks, these threats could lead to a ¥300 to ¥600 drop in valuation.

📊 SWOT Summary Table

SWOT analysis summary table for SoftBank FY2025, listing strengths such as profit rebound and Vision Fund 1 gains; weaknesses including Vision Fund 2 losses and high debt; opportunities in AI investments and Arm monetization; and threats like China exposure and tech valuation risk. Each category includes estimated stock price impact ranges in Japanese yen.

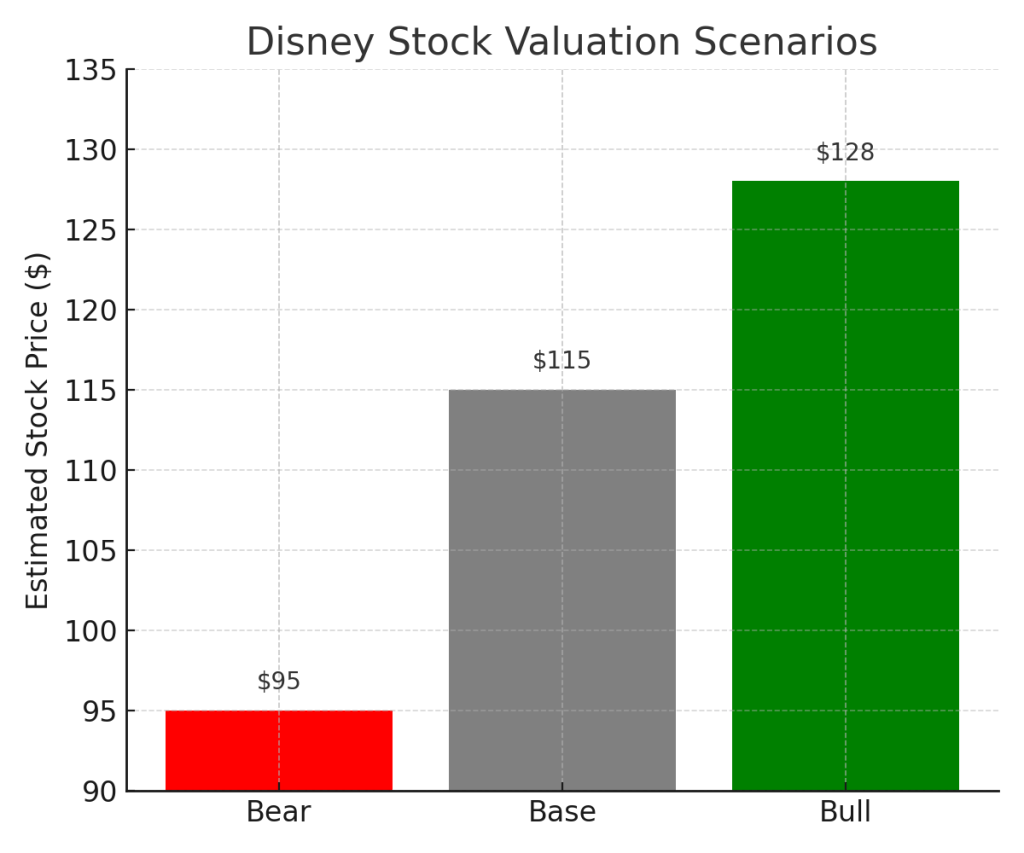
📈 SoftBank Valuation Outlook: What the Scenarios Say

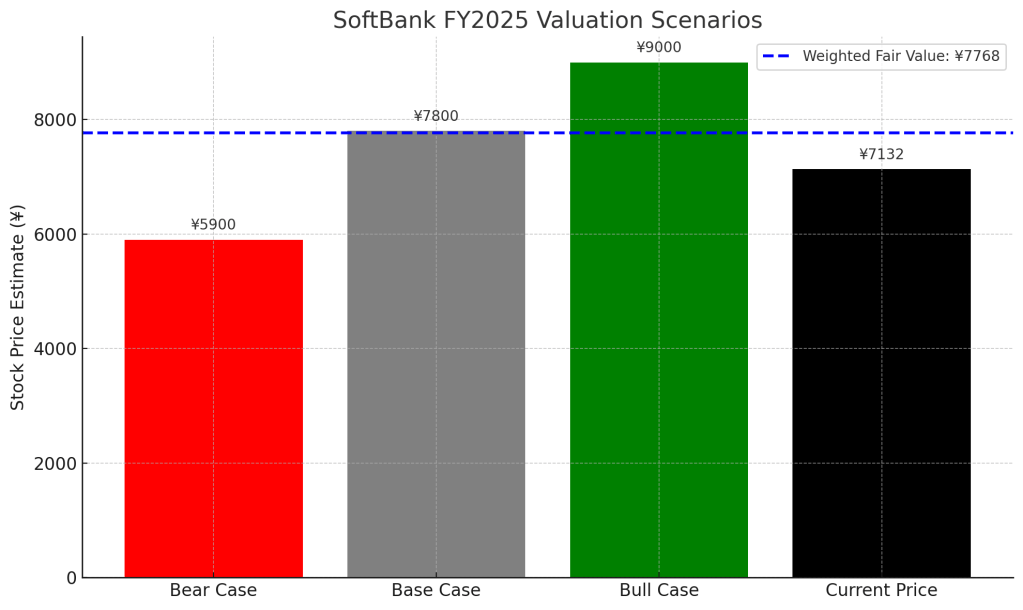
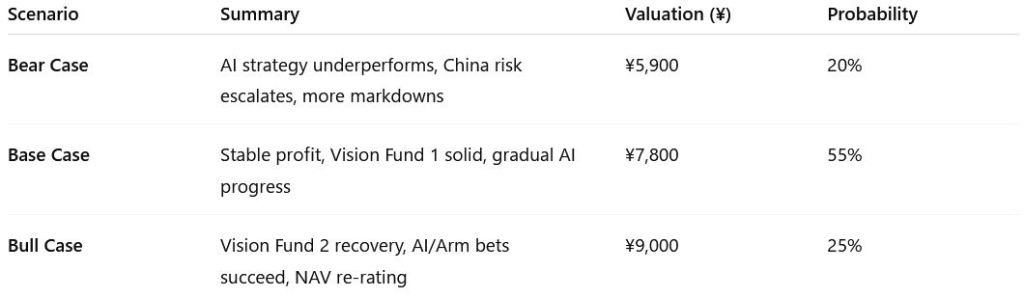
🟢 Bull Case – ¥9,000/share (25% probability)

In the most optimistic scenario, SoftBank’s AI strategy delivers early wins: Ampere gains market traction, OpenAI collaboration creates monetizable infrastructure, and the Vision Funds return to consistent profitability. With key portfolio holdings like Arm appreciating further and public market sentiment improving, SoftBank’s NAV discount begins to narrow. If earnings stabilize and the market applies a 0.9x multiple to net asset value (up from the current 0.6x), the stock could reach ¥9,000. This case reflects investor confidence in SoftBank evolving into a key AI ecosystem enabler—and we assign it a 25% probability.

⚪ Base Case – ¥7,800/share (55% probability)

The base case assumes steady execution across SoftBank’s core holdings. Vision Fund 1 remains profitable, and Vision Fund 2 stabilizes but still underperforms. AI investments progress but require time to show returns. The company continues monetizing assets like Arm while maintaining financial discipline. We apply a 0.75x NAV multiple to a stable book value, yielding a target price of ¥7,800. This scenario reflects the most likely trajectory based on current guidance and investment pacing.

🔴 Bear Case – ¥5,900/share (20% probability)

In the downside case, Vision Fund 2 continues to post significant losses, and macro/geopolitical headwinds—particularly China exposure—impact SoftBank’s tech-heavy portfolio. AI investments struggle to gain traction or consume more capital than expected. If NAV contracts and the market applies a more conservative 0.55x multiple, the stock could decline to ¥5,900. While less probable, this scenario reflects the risk of execution delays and external shocks, especially in the global tech sector.

Table outlining SoftBank's FY2025 valuation scenarios: bear case at ¥5,900 with 20% probability, base case at ¥7,800 with 55% probability, and bull case at ¥9,000 with 25% probability. Includes a weighted fair value estimate of ¥7,768 and current stock price of ¥7,132, implying around 9% upside.

🎯 Weighted Probability Valuation

(¥9,000 x 0.25) + (¥7,800 x 0.55) + (¥5,900 x 0.20) = ¥7,768

Current price: ¥7,132 (as of May 13,2025)
Upside: ~+9%


📝 Final Take: Is SoftBank Stock Worth It?

If you trust the numbers and think SoftBank can execute its AI strategy, the stock looks modestly undervalued. But it comes with real risks. This isn’t a set-it-and-forget-it stock—you’ll want to watch each quarter closely.


📢 Stay Ahead: Get More Stock Breakdowns Like This

Want more plain-English stock breakdowns like this? Subscribe now and get the next one before the headlines hit.


⚠️ Disclaimer

This analysis is based only on SoftBank’s official financial report and earnings call. It is not investment advice. Always do your own research before investing.


Leave a comment


Disney Q2 2025 Earnings: Streaming Profits, Theme Park Ambitions—But Is the Stock Already Running Ahead?

Disney Q2 2025 earnings blog post analyzing revenue growth, streaming profitability, and theme park expansion, featuring a full SWOT analysis, stock price impact estimates, and valuation scenarios to guide retail investors.

Quarter Recap: Disney Delivers a Comeback Quarter

Disney’s (NYSE: DIS) Q2 2025 numbers show it’s more than just nostalgic IP. Revenue came in at $23.6 billion, up 7% from last year. Adjusted EPS hit $1.45—up 20%. Net income surged to $3.3 billion, a massive rebound from the prior year.

Investors liked what they saw. Disney stock jumped nearly 10% after the report dropped, reflecting growing confidence that the company’s turnaround is real.

Two major wins stood out:

  • Streaming operations posted positive income.
  • The Experiences segment (parks, cruises) delivered another strong quarter.
Line chart showing Disney’s revenue and net income over the past five quarters, highlighting a sharp increase in net income during Q2 2025.

Segment Breakdown: Who’s Pulling the Weight

Streaming (Disney+, Hulu, ESPN+)

  • Turned a profit this quarter
  • Subscriber growth continued, though at a steadier pace
  • Bundling and cost control drove the improvement

Experiences (Parks & Cruises)

  • Revenue: $8.9 billion
  • Strong demand in both U.S. and international parks
  • Cruise occupancy and ticket yields improved

Linear Networks (TV/Cable)

  • Continues to shrink
  • Revenue and ad sales declined

Strategic Moves: Where the Magic’s Going

Disney’s not sitting still. Management is investing heavily—planning $60 billion over 10 years to expand its Experiences segment. That includes international projects like a new theme park in Abu Dhabi, upgrades to existing resorts, and cruise capacity expansion.

Streaming is also evolving. A standalone ESPN platform is on the way—positioning Disney to reach sports fans directly without traditional cable. Combined with cost discipline and cross-platform synergy, this is Disney trying to play offense again.


SWOT Analysis: What Could Move the Stock Next

Strengths: Streaming Turnaround and Park Momentum

Disney is now running a profitable streaming business while theme parks continue to print cash. Add global brand power and unmatched IP—this is a combo few can replicate.

Stock Impact Estimate: + $6 to $10


Weaknesses: Old Media Drag and Content Costs

Linear TV’s decline is structural. Meanwhile, content creation isn’t cheap—especially with high production expectations for Marvel, Star Wars, and beyond. That’s still weighing on margins.

Stock Impact Estimate: – $3 to $6


Opportunities: Global Expansion, ESPN+, IP Leverage

Disney is one of the few entertainment giants that can build both digital and physical experiences. ESPN’s direct-to-consumer rollout and international park projects are growth levers that haven’t fully priced in yet.

Stock Impact Estimate: + $5 to $9


Threats: Macro, Competition, and Saturation

High inflation, consumer fatigue, and stiff competition from Netflix, Amazon, and Apple TV+ are risks. Streaming growth isn’t unlimited, and pricing power may be tested.

Stock Impact Estimate: – $4 to $8


SWOT Summary

Strengths

  • Streaming profitability, parks growth, brand power
  • Impact: +$6 to +$10

Weaknesses

  • Content cost, TV decline, capex pressure
  • Impact: –$3 to –$6

Opportunities

  • Park expansion, ESPN DTC, franchise bundling
  • Impact: +$5 to +$9

Threats

  • Inflation, competition, platform fatigue
  • Impact: –$4 to –$8

Valuation Scenarios: Is the Stock Still Undervalued?

ScenarioTarget PriceAssumptionsProbability
Bull$128Streaming accelerates, parks outperform30%
Base$115Solid execution, steady growth50%
Bear$95Macro slows demand, investments lag20%
Horizontal bar chart illustrating estimated stock price impact by SWOT category for Disney Q2 2025, with strengths and opportunities showing positive influence and weaknesses and threats showing negative impact.

Weighted Fair Value Estimate: $114.90
Current Price: ~$108
(Stock popped ~10% post-earnings but still under fair value)


How Disney Stacks Up vs Rivals

  • Netflix: Still bigger in subscribers, but less diversified—no theme parks or physical cash engines
  • Amazon & Apple: Use streaming to support other businesses. Disney is the content and experience business
  • Comcast: More reliant on cable; Disney’s pivot to DTC looks stronger

Final Verdict: Is Disney Stock Still a Buy?

This was a strong quarter. Disney showed it can run a leaner, smarter business while building for the future. Streaming works. Parks are growing. And IP monetization across content, sports, and experiences is just getting started.

The stock is no longer a bargain—but it’s also not overpriced. At ~$108, it’s trading slightly below our fair value estimate. For investors who want long-term exposure to a globally integrated content company, Disney looks like a smart hold with upside.


What to Watch Next

  • ESPN Standalone Launch: Could attract new DTC revenue
  • Subscriber Churn: Especially outside U.S.
  • Next Park Announcement or Capex Update
  • Profitability Trends: Are margins expanding or flatlining?

Call to Action

Like this breakdown?
Follow @SWOTstock on Instagram for real earnings analysis—no hype, no jargon.
And subscribe to stay ahead of the next big earnings move.


Disclaimer

This post is based exclusively on Disney’s official Q2 2025 earnings report and conference call. It does not use analyst projections or third-party commentary. Please do your own research before making investment decisions.


Occidental Petroleum Q1 2025 Earnings: Cash Flow Strength Meets Geopolitical Uncertainty

Occidental Petroleum’s Q1 2025 results show strong cash flow, rising production, and a dividend hike—but geopolitical risks and oil price volatility remain. This detailed analysis breaks down key highlights, SWOT insights, valuation scenarios, and whether OXY stock is undervalued. Perfect for investors seeking data-driven clarity.


Summary: Occidental Petroleum Q1 2025 Earnings at a Glance


Occidental Petroleum (NYSE: OXY) posted strong Q1 2025 results with $1.2B in free cash flow and a 9% dividend hike. Operational efficiency and debt repayment continue to strengthen the balance sheet. However, risks from geopolitical tensions, commodity price swings, and trade-related costs are rising. The stock appears slightly undervalued, but uncertainty clouds the upside.


Quarter Recap: Occidental’s Operational Muscle

OXY reported Q1 2025 revenue of $6.84 billion and net income of $766 million. Adjusted EPS came in at $0.87, beating expectations. Production reached 1.391 million barrels of oil equivalent per day—up 19% year over year—driven by strong output from the Permian Basin.

Management struck a confident tone, emphasizing capital discipline, progress on carbon capture, and continued debt reduction. $2.3B in debt was repaid YTD, with free cash flow before working capital totaling $1.2B. Still, volatility in oil markets and uncertainty in global politics weighed on the call.


Occidental’s Key Financial Highlights

  • Revenue: $6.84B (+YoY, beat estimates)
  • Net income: $766M
  • Adjusted EPS: $0.87 (beat by $0.10)
  • Free Cash Flow: $1.2B (pre-WC)
  • Production: 1.391 Mboe/d (+19% YoY)
  • Debt Reduction: $2.3B paid YTD
  • Dividend: Raised 9% to $0.24/share
Line chart showing Occidental Petroleum’s revenue and net income growth over the last five quarters, highlighting strong cash generation in Q1 2025.

Strategic Context: How OXY Stacks Up

OXY’s earnings outperform many mid-cap peers and rival some larger producers in terms of cash efficiency. When compared to Chevron and ExxonMobil, Occidental maintains a leaner capital structure and more aggressive debt paydown. Additionally, its stake in Direct Air Capture (DAC) positions it as a forward-leaning ESG player.


SWOT Analysis: Occidental Petroleum Q1 2025

Let’s break it down using the SWOT framework—what’s working, what’s not, where the upside is, and what risks could derail the stock.

Strengths

  • Strong free cash flow ($1.2B) and operating cash flow ($3.0B pre-WC)
  • Production up 19% YoY
  • $2.3B in YTD debt reduction
  • Dividend hike of 9% reflects confidence
    Stock Impact Estimate: +$3 to +$5/share

Weaknesses

  • Midstream segment loss ($77M, mainly derivatives)
  • Margin pressure in OxyChem from lower PVC and caustic soda prices
    Impact Estimate: -$1 to -$2/share

Opportunities

  • Oman Block 53 extension (+800M BOE potential)
  • Permian drilling efficiency: 17% faster, 18% lower cost per well
  • Carbon Capture growth (DAC and CO2-EOR initiatives)
    Impact Estimate: +$4 to +$7/share

Threats

  • Oil price volatility
  • Tariffs, carbon regulations, and U.S.-China trade tension
  • Geopolitical risks (e.g., Russia–Ukraine conflict)
    Impact Estimate: -$4 to -$7/share

SWOT Summary Table

ElementDriversEst. Stock Impact
StrengthsFCF growth, debt paydown, dividend increase+3 to +5
WeaknessesMidstream losses, OxyChem margin pressure-1 to -2
OpportunitiesOman reserves, Permian efficiency, Carbon Capture+4 to +7
ThreatsOil price risk, geopolitics, carbon tariffs-4 to -7
    Horizontal bar chart displaying estimated stock price impact ranges for Occidental Petroleum’s strengths, weaknesses, opportunities, and threats.

Valuation Scenarios Based on Q1 2025 Outlook

ScenarioSummaryPrice TargetProbability
Bull CaseOil >$85, Oman extension secured, carbon tech monetized$5017.7%
Base CaseStable oil, solid production, modest growth$4462.1%
Bear CaseOil < $70, geopolitics worsen, OxyChem softens$3620.2%

Probability-weighted Fair Value: $43.45/share
Current Price: $41.44/share

Vertical bar chart comparing Occidental Petroleum’s bear, base, and bull stock valuation scenarios for Q1 2025.

Verdict: Slightly Undervalued, But Watch the Headlines

OXY continues to generate strong financial results and is aggressively improving its balance sheet. But as macro uncertainty rises, the margin of safety narrows. For long-term investors, the upside case is intact—yet near-term volatility should not be ignored.


Subscribe for More

Want weekly stock breakdowns like this one—with no jargon, just insight? Follow and subscribe to SWOTstock.


Disclaimer

This blog is based solely on Occidental Petroleum’s official Q1 2025 earnings report and call transcript. It does not constitute financial advice. Please do your own research before making any investment decisions.


Leave a comment